Message in the Bottle
A Forensic Lens to Help Decode the Parabolic Semiconductor Boom

The iShares Semiconductor ETF holds thirty stocks. Sixty percent of the basket sits in the top ten holdings. Of those ten, eight have material disclosed revenue dependency on a customer set of six firms: Microsoft, Meta, AWS, Oracle, Google, and OpenAI. Those six customers are bound to OpenAI by approximately one trillion dollars of contracted spending against twenty five billion dollars of current annualised revenue. They are bound to NVIDIA by a one hundred billion dollar equity letter of intent that vests against hardware deployment, and by a forty billion dollar plus equity portfolio in which every name is also a customer. They are bound to AMD by three hundred and twenty million penny warrants representing approximately twenty percent of the diluted share count. They are bound to Oracle by a five hundred and twenty three billion dollar remaining performance obligation balance, up four hundred and thirty eight percent year over year, dominated by a single OpenAI contract.
None of these arrangements is fraudulent. All are disclosed in primary filings. The thesis of this article is that the aggregate of fully legal, fully disclosed circular financing arrangements among a small set of mutually dependent counterparties has produced a coordinated demand signal that materially overstates the durable end market for the products in question, and that a passive holder of SOXX is, in May 2026, exposed to that overstatement to a degree the index label does not advertise.
“Concentration risk and circular financing are not separate concerns. They are the same concern, viewed from different angles. Concentration is what happens when the loop stops. Circular financing is why the loop is unstable.”
This article is built around thirteen exhibits. The first three are system level. The next ten are one per holding ecosystem diagrams in the Bloomberg style, each showing the M&A history, equity portfolio, customer concentration, and recursive linkages that define how the company actually makes money in 2026. The last three return to the system view and address the question that none of the individual exhibits can answer alone, which is whether the loop, taken as a whole, produces durable external cash flow growth or merely the appearance of it.
The basket and the loop
Before the per-holding deep dives, lets look at the system. The diagram below places all ten SOXX top holdings around the AI capex loop in a single frame. Eight of the ten holdings, accounting for fifty three percent of basket weight, sit inside the loop with material disclosed customer ties to one or more hyperscalers and OpenAI. Two holdings, Texas Instruments and NXP, sit outside it. Those two account for seven point eight five percent of basket weight.
Six of the eight inside-the-loop names have three or more hyperscaler ties each. NVIDIA has seven. The asymmetry is not subtle. A passive investor buying SOXX in May 2026 is not buying ten diversified semiconductor businesses. They are buying eight bets on a single customer cohort plus two analog companies that happen to be in the index for historical reasons.
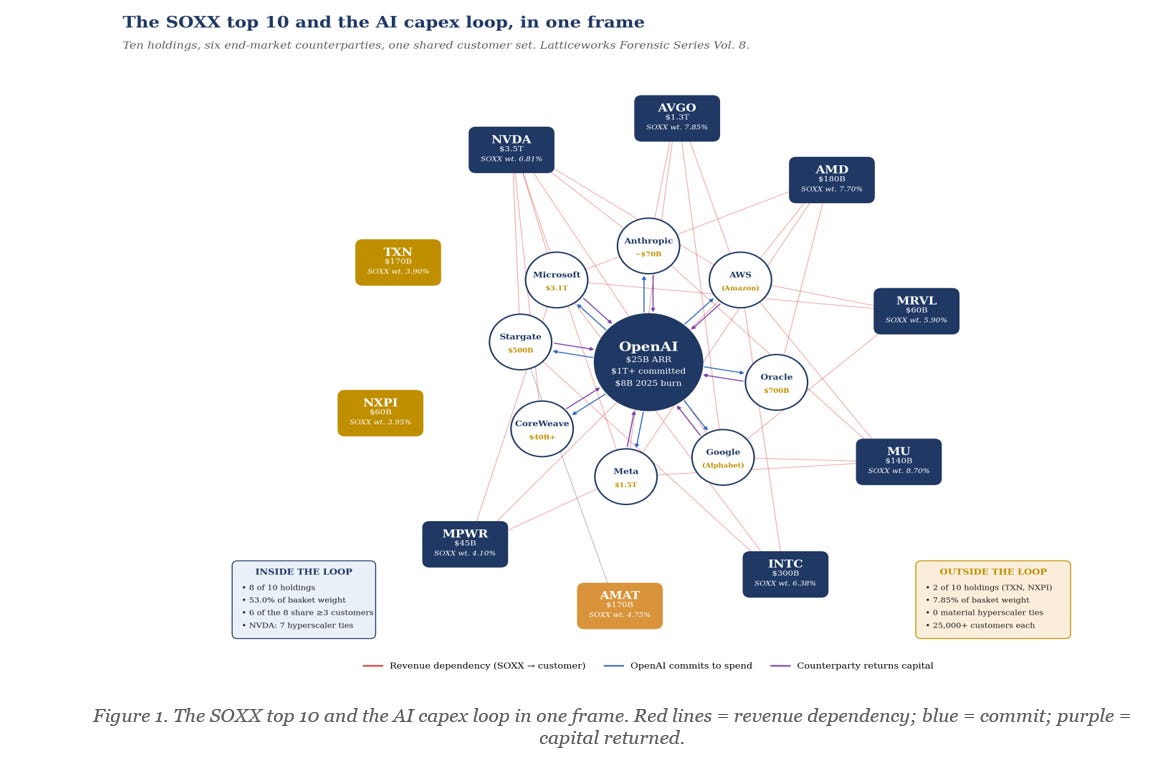
The reader who is short on time can stop at Figure 1 and have correctly understood the thesis. The remainder of this article is the forensic work that supports the diagram. It is structured for the reader who needs the underlying transaction trail to take an investment view.
The shared customer problem
The second system level exhibit re-cuts the same data with the holdings on the left and the end-market customers on the right. The ribbon width corresponds to revenue concentration in the customer relationship. The point of the diagram is to make a single observation visible: the customer set on the right is small.
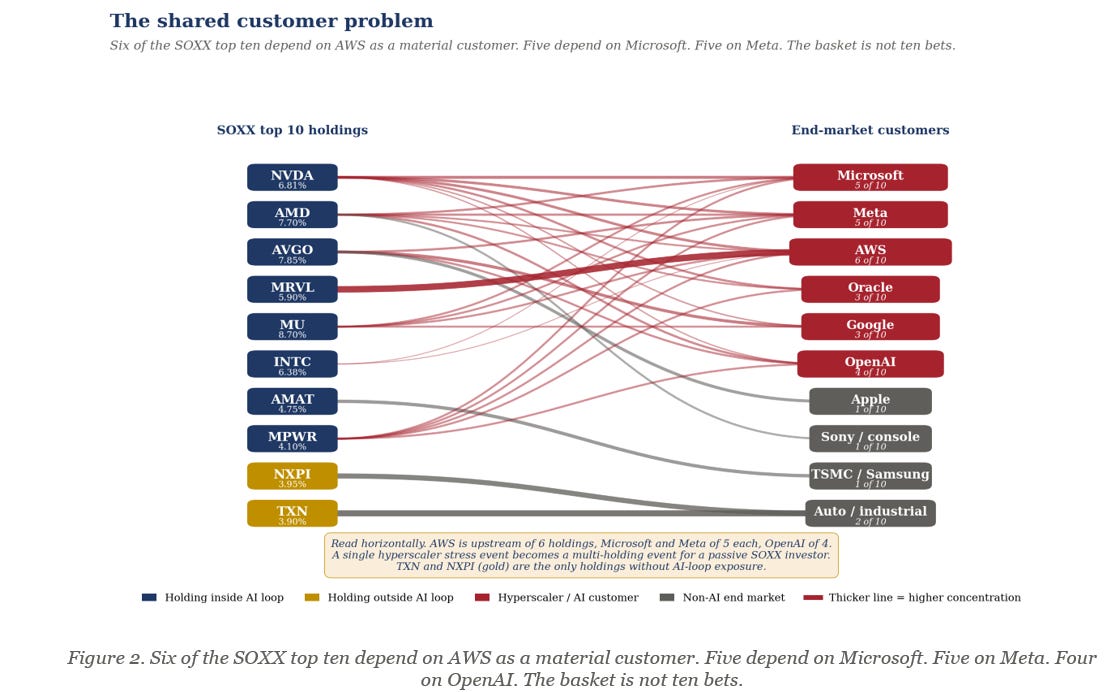
Read horizontally. AWS sits upstream of six of the ten holdings, including the seventy six percent Marvell data centre concentration that has anchored the company’s earnings model since the Trainium ramp began. Microsoft and Meta each sit upstream of five. OpenAI sits upstream of four, which understates its true influence because OpenAI’s deployments flow through the hyperscalers and through CoreWeave, double counting if you were to add the columns naively.
This is the structural problem that no single holding can diversify away. A material capital allocation review by any one of AWS, Microsoft, Meta, or Google is not a single ticker event. It is a six, five, five, or three ticker event respectively. For a passive holder, the basket beta is therefore higher than the individual betas would suggest because the names share a single dominant risk factor.
The OpenAI number
OpenAI’s accounting deserves two figures, not one. Recognised revenue for calendar 2025 was approximately thirteen billion dollars per CNBC sources reporting in February 2026, beating the company’s own internal target of ten billion dollars. The annualised revenue run rate, which the company prefers in its public statements and which excludes Microsoft licensing and one off deals, exited 2025 at roughly twenty billion dollars and crossed twenty five billion dollars in February 2026 per Sacra and The Information. The two metrics are not the same thing. The first counts dollars that have already been recognised in financial statements. The second projects forward from the most recent monthly revenue. In a fast scaling business they diverge meaningfully, which is the point of having both.
Cash burn in 2025 was eight billion dollars, lower than the nine billion dollars that had been internally projected. Forward burn for 2026 is projected at seventeen billion dollars based on the same investor materials. Both numbers are sourced to documents shared with investors, and both should be in any institutional model.
The contracted spending figure has also moved. In November 2025, Sam Altman publicly cited one point four trillion dollars of infrastructure commitments over eight years. By February 2026, the company was telling investors the actual planned compute spend through 2030 is closer to six hundred billion dollars, a number with a defined timeline and explicit linkage to a 2030 revenue target of two hundred and eighty billion dollars. The aggregate of disclosed bilateral contracts, when summed at face, lands at roughly one trillion dollars. The walkback from one point four trillion was a clarification of what the headline number had always contained, which is a sum of letters of intent, conditional minimum volume agreements, and tranche based vesting structures.
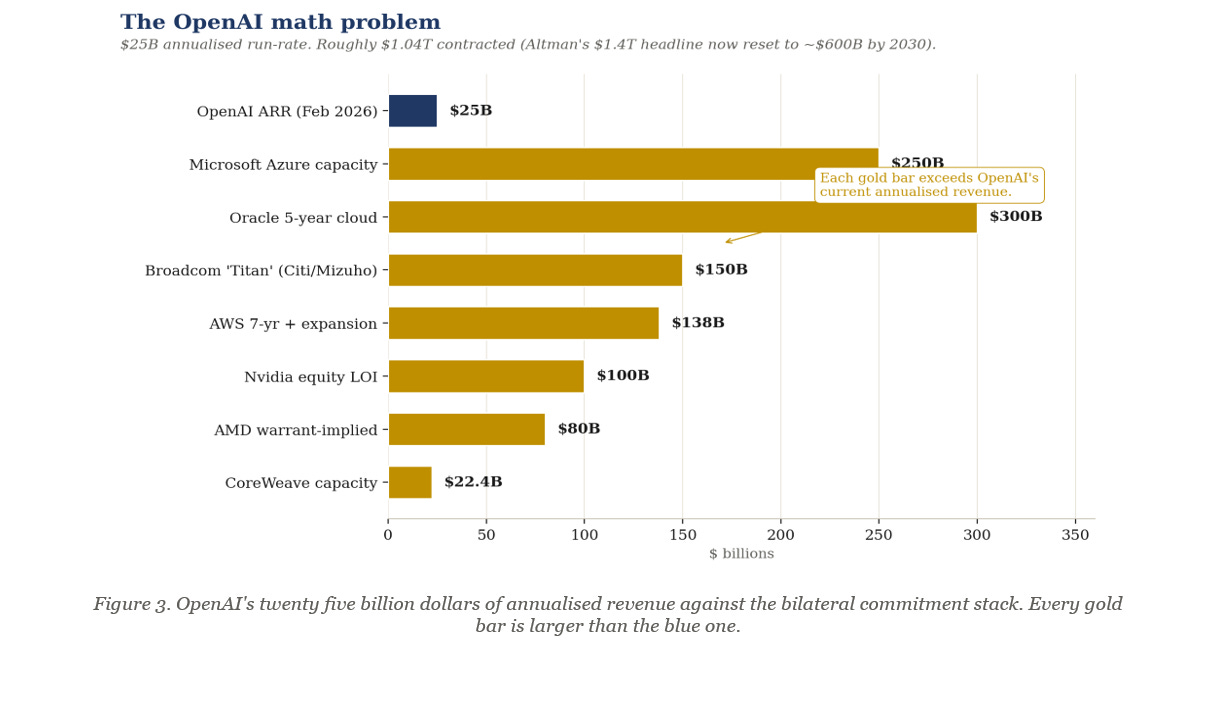
There are, mechanically, two ways for the gap between twenty five billion dollars of annualised revenue and one trillion dollars of contracted obligations to close. Revenue can grow rapidly, or commitments can shrink. Historical base rates favour some combination of both, although history is unhelpfully silent on the timing. The February 2026 reset from one point four trillion to six hundred billion was the first observable move on the commitment side. The April 2026 sell off on a leaked OpenAI revenue miss was the first observable test of the revenue side. Neither was thesis breaking. Both should be in the institutional reader’s running journal.
NVIDIA: The investor whose portfolio is the order book
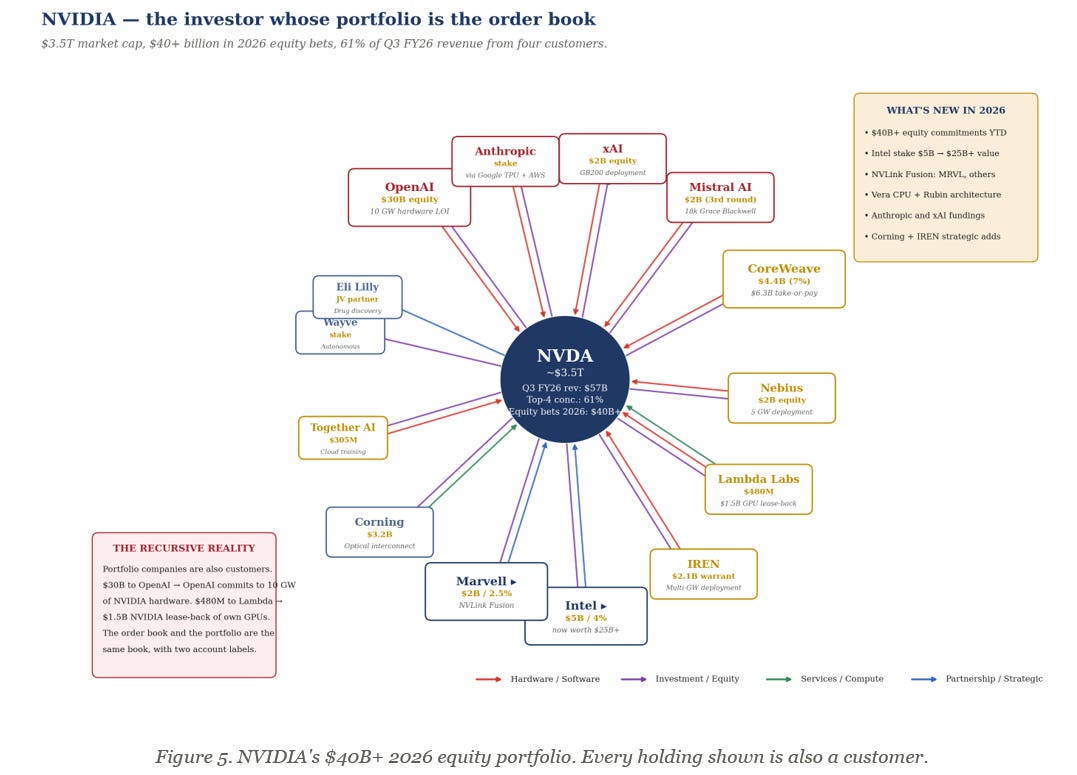
M&A and equity portfolio
NVIDIA’s historical M&A spend is modest by hyperscaler standards. The failed Arm acquisition (forty billion dollars announced 2020, terminated 2022 on UK CMA and US FTC objections) is the largest line item. The Mellanox acquisition closed April 2020 for six point nine billion dollars and remains the foundation of the data centre networking business. Run Run.ai (early 2024) and Mellanox-style smaller adds account for the rest. The story since 2024 is not M&A but minority equity in customers, and the scale of that activity is unprecedented for an operating company of NVIDIA’s profile.
In calendar 2025 NVIDIA disclosed seventeen point five billion dollars in private company and infrastructure fund investments. In the first four months of 2026 alone the company committed an additional forty plus billion dollars. The thirty billion dollar OpenAI letter of intent is the single largest line, structured as equity that vests against hardware deployment milestones for ten gigawatts of Vera Rubin systems. The CoreWeave stake, now valued at approximately four point four billion dollars representing seven percent of the company, sits alongside a six point three billion dollar take or pay agreement for unsold compute capacity. The Nebius investment of two billion dollars came with an explicit five gigawatt deployment commitment. The Lambda Labs investment of four hundred and eighty million dollars was followed by NVIDIA leasing back eighteen thousand of its own GPUs from Lambda in a one point five billion dollar deal — a transaction that, as the Rothschild Growth Equity Update noted, presumably involved chips that Lambda had previously bought from NVIDIA. The xAI stake of two billion dollars sits in a twenty billion dollar funding round structured to fund GB200 deployment. The two billion dollar Mistral stake was the third NVIDIA participation in that name, supporting an eighteen thousand Grace Blackwell deployment in France. The Intel stake of five billion dollars closed December twenty sixth 2025 at twenty three dollars and twenty eight cents per share, four percent of the company, now worth approximately twenty five billion dollars. The Marvell stake of two billion dollars closed March thirty first 2026 at two point five percent for the NVLink Fusion partnership. The IREN warrant of up to two point one billion dollars supports multi gigawatt deployment. The Corning investment of up to three point two billion dollars secures optical interconnect supply chain capacity.
Customer concentration
The Q3 FY26 10-Q disclosure is the operative document. Four direct customers each accounted for more than ten percent of revenue, collectively sixty one percent. Customer A was twenty two percent, B fifteen percent, C thirteen percent, D eleven percent. The market consensus identifies these as Microsoft, Meta, the ODM channel feeding multiple hyperscalers, and a fourth hyperscaler. The eleven percent customer in the most recent quarter has been growing rapidly and is most plausibly Oracle’s OpenAI buildout, though NVIDIA has not confirmed this. Indirect customers through ODMs (Super Micro, Dell, HPE) add another layer of concentration that the disclosed numbers do not capture. A reasonable analyst estimate is that the top six end customers, including the indirect routing through ODMs, account for seventy five to eighty percent of data centre revenue.
The recursive structure
The portfolio companies are also the customers. Thirty billion dollars to OpenAI funds OpenAI’s commitment to ten gigawatts of NVIDIA hardware. Two billion to xAI funds xAI’s GB200 deployment. Two billion to CoreWeave funds CoreWeave’s purchases of Rubin Ultra and Vera systems. Four hundred and eighty million to Lambda becomes one point five billion of GPU lease-back. Capital flows out as equity and flows back as hardware purchases inside the same fiscal year. The disclosure is complete. The economic substance is that NVIDIA’s portfolio is its order book, and the order book is its portfolio. Customer concentration risk and equity portfolio risk are the same risk.
AMD: The penny-warrant strategy
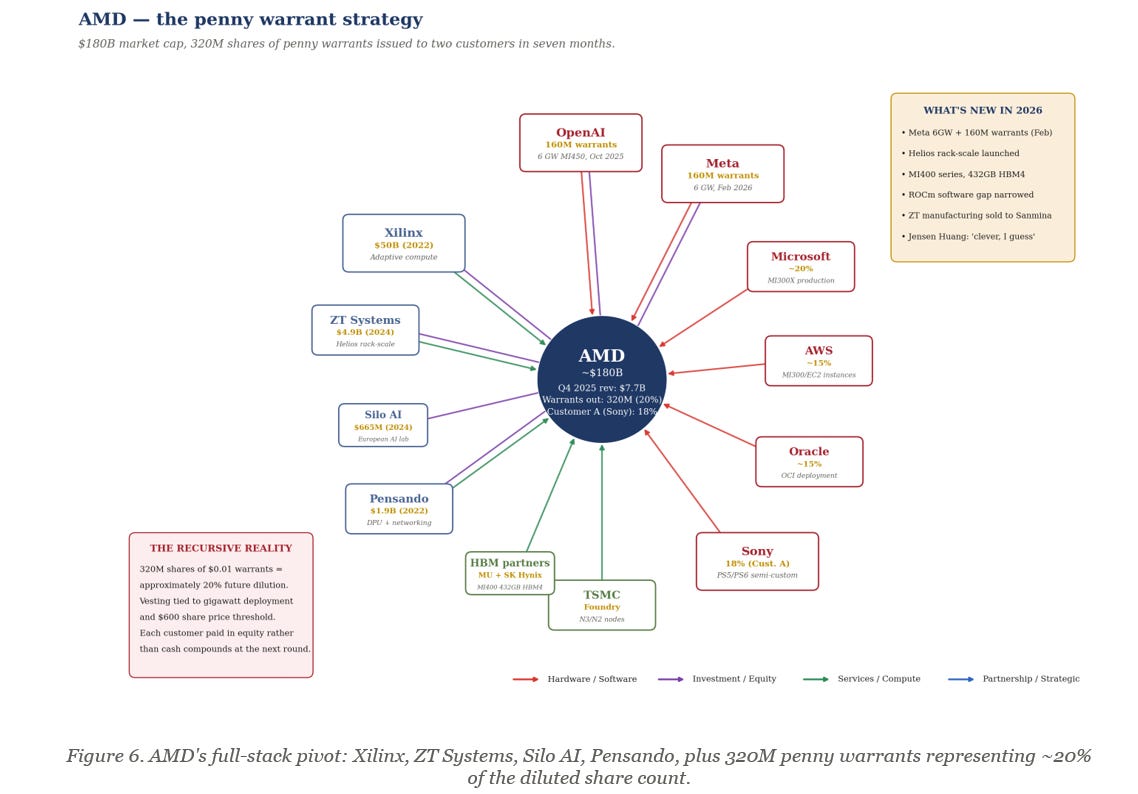
M&A history
AMD’s M&A program is the most consequential of the SOXX top ten over the past five years. The Xilinx acquisition closed February 2022 for approximately fifty billion dollars in stock, the largest semiconductor deal of its era. Xilinx brought adaptive computing, FPGA expertise, and the Versal product line, which AMD has since integrated into the data centre, embedded, and telecom businesses. The Pensando acquisition closed May 2022 for one point nine billion dollars and provided programmable data plane silicon now integrated into the Helios platform networking stack. The Silo AI acquisition closed August 2024 for six hundred and sixty five million dollars, adding a Helsinki based AI services team focused on open model development. The most strategically significant recent acquisition is ZT Systems, announced August 2024 for four point nine billion dollars and closed in 2025. AMD divested ZT’s manufacturing arm to Sanmina to avoid competing with Dell and HPE while retaining over one thousand design and customer enablement engineers. This team has been instrumental in developing the Helios rack-scale architecture, AMD’s direct competitive response to NVIDIA’s GB200 NVL72.
The penny warrant structure
The defining feature of AMD’s 2025-26 corporate finance is the penny warrant structure. In October 2025 AMD announced a six gigawatt OpenAI deployment commitment over multiple years, supported by warrants for one hundred and sixty million AMD shares struck at one cent per share. In February 2026 AMD announced a substantively identical structure with Meta, again for six gigawatts, again for one hundred and sixty million warrants at one cent. The combined three hundred and twenty million warrants represent approximately twenty percent of AMD’s current diluted share count of one point six three billion. Vesting is tied to deployment milestones and to AMD’s share price reaching six hundred dollars. The economic effect is that AMD has paid roughly twenty percent of its equity to lock in two anchor customers for the MI400 series.
Customer concentration
AMD’s customer disclosure is less granular than NVIDIA’s, but the analyst-mosaic estimate for data centre GPU revenue is: Microsoft approximately twenty percent, Meta approximately twenty percent, AWS approximately fifteen percent, Oracle approximately fifteen percent, OpenAI approximately twenty percent (post 2026 ramp), and other approximately ten percent. Customer A in the most recent 10-Q is Sony at eighteen percent, reflecting the PlayStation 5 semi-custom business which is now in its mature decline phase. The MI400 series with four hundred and thirty two gigabytes of HBM4 memory targets a Q4 2026 to Q1 2027 ramp. The Helios platform is positioned as a plug-and-play alternative to GB200 NVL72 for customers seeking to dual-source. The strategic logic is sound. The cap table dilution is severe.
Broadcom: Six XPU customers and $69B of VMware
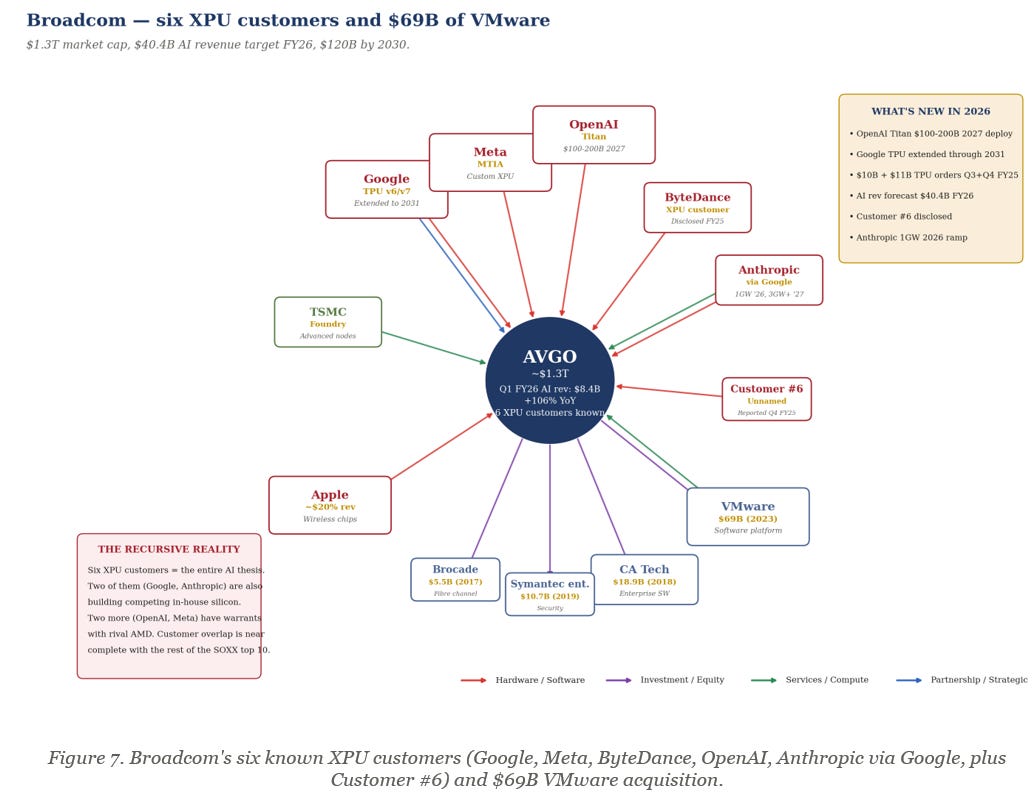
M&A history
Broadcom under Hock Tan has been the most acquisitive semiconductor company of the past decade. Brocade for five point five billion dollars in 2017 brought fibre channel networking. CA Technologies for eighteen point nine billion dollars in 2018 was the first move into enterprise software. Symantec’s enterprise security business for ten point seven billion dollars in 2019 deepened the software footprint. LSI for six point six billion dollars in 2014 anchored the storage controller business. The defining acquisition is VMware for sixty nine billion dollars announced May 2022 and closed November 2023. The VMware integration has been the largest source of margin expansion in the company over the past two years, with software now contributing approximately forty percent of total revenue at gross margins above ninety percent. The Qualcomm hostile bid in 2017-18 (one hundred and twenty one billion dollars) was blocked by the Trump administration. The VMware acquisition met no such resistance.
The XPU franchise
Broadcom’s custom silicon design business is the highest quality growth story in the SOXX top ten. The company has disclosed six XPU customers. Google’s TPU program, originally TPU v1 in 2016, is now in v6 (Trillium) and v7 (Ironwood) and has been extended through 2031 per Google’s own disclosures. Meta’s MTIA program (Meta Training and Inference Accelerator) is in its second generation and ramping. ByteDance was disclosed as a customer in Q4 FY25. OpenAI’s Titan program was disclosed in 2025 with a ten gigawatt deployment target for 2027, valued by Citi at one hundred billion dollars and by Mizuho at one hundred and fifty to two hundred billion dollars. Anthropic flows through the Google TPU relationship with one gigawatt deployment scheduled for 2026 and three gigawatts plus for 2027. Customer #6 was disclosed in Q4 FY25 but not named.
Financial trajectory
Broadcom’s Q1 FY26 AI revenue was eight point four billion dollars, up one hundred and six percent year over year. The company has guided to forty point four billion dollars in AI revenue for FY26 and one hundred and twenty billion dollars by 2030. The TPU order book disclosed in Q3 FY25 was ten billion dollars, with an additional eleven billion dollar order disclosed in Q4. Apple remains a meaningful customer at approximately twenty percent of total revenue for wireless chips, though the strategic narrative has shifted entirely to AI custom silicon. The risk concentration is unusual: six XPU customers, four of whom (Google, Meta, OpenAI, Anthropic) are inside the AI capex loop and one of whom (ByteDance) has unique geopolitical exposure. Broadcom is the closest thing the basket has to a pure AI play, and that purity cuts in both directions.
Marvell: 76% AWS and the NVIDIA $2B
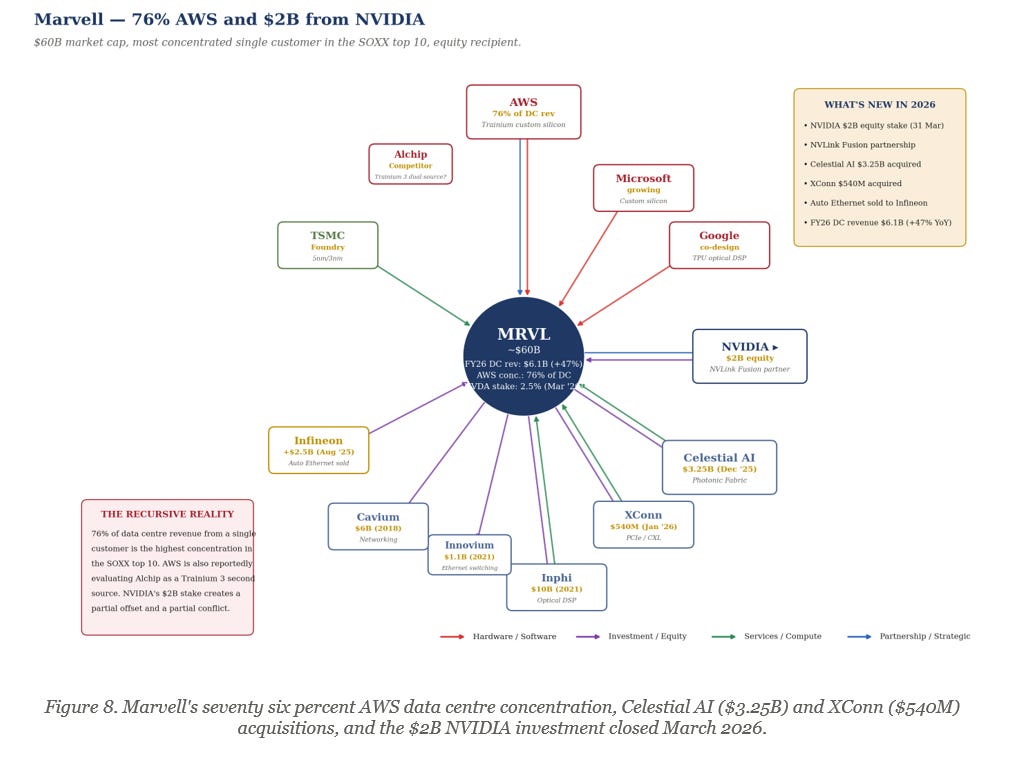
M&A history
Marvell has been the most aggressive mid-cap M&A consolidator in the SOXX top ten. The Cavium acquisition (November 2017, six billion dollars) brought ARM server processors and security silicon. Aquantia (September 2019) added multi-gigabit Ethernet PHYs. Avera Semiconductor (September 2019, billion dollar range from GlobalFoundries) added custom ASIC capabilities and was the foundation for the AWS Trainium relationship. Inphi (April 2021, ten billion dollars) was the largest deal in company history and brought high-speed analog, optical interconnect, and DSP capabilities. Innovium (October 2021, one point one billion dollars) added high-radix Ethernet switching. The Celestial AI acquisition (December 2025, three point two five billion dollars) brought photonic fabric technology designed to enable GPUs to access external memory pools at near-local speeds. XConn (January 2026, five hundred and forty million dollars) added PCIe and CXL switching. The August 2025 divestiture of the automotive Ethernet business to Infineon for two point five billion dollars marked the company’s exit from the auto market to refocus entirely on data centre.
The AWS concentration
Marvell’s data centre business is dominated by a single customer relationship, though the precise concentration is not disclosed at the 10-K level. The FY25 Marvell 10-K discloses only that two customers (one distributor and one direct customer) each accounted for ten percent or more of total net revenue, without naming the customers or providing the exact percentages. Third-party analyst work, principally a Klover.ai analysis dated August 2025 citing publicly available data, estimates that a single customer, widely understood to be AWS, accounted for approximately seventy six percent of Marvell’s data centre segment revenue in one recent period. The institutional reader should treat the seventy six percent figure as a credible analyst estimate, not a disclosed fact. What is disclosed is the relationship’s existence and materiality. The estimate is consistent with the documented co-design history on Trainium since the 2019 Avera acquisition. FY26 data centre revenue of six point one billion dollars, up forty seven percent year over year, is from Marvell’s own reporting. The single-customer concentration, at whatever the true figure is, is plausibly the highest in the SOXX top ten by a wide margin. The risk is partially mitigated by the multi-year nature of custom silicon programs (Trainium 2 and 3 are committed) but also amplified by AWS’s known willingness to dual source. Reports indicate AWS has engaged Alchip as an alternative supplier for Trainium 3, which the market should treat as a thesis-relevant signal.
The NVIDIA partnership
On March thirty first 2026, NVIDIA announced a two billion dollar equity investment in Marvell at approximately two point five percent ownership, structured around the NVLink Fusion partnership. The deal connects Marvell’s custom XPUs and optical DSP capabilities to NVIDIA’s AI factory ecosystem. Marvell will provide custom XPUs and NVLink Fusion-compatible scale-up networking; NVIDIA contributes Vera CPU, ConnectX NICs, Bluefield DPUs, NVLink interconnect, and Spectrum-X switches. The Celestial AI photonic fabric technology is the strategic centerpiece. Industry analysis suggests this partnership is fundamentally about NVIDIA hedging its custom silicon exposure rather than displacing AMD or Broadcom. The recursive concern: Marvell’s biggest customer, AWS, is building Trainium specifically to replace NVIDIA GPUs. Marvell is now jointly developing technology with the company its biggest customer is competing against. The strategic positioning is therefore genuinely complex.
Micron: HBM monopoly inside a duopoly
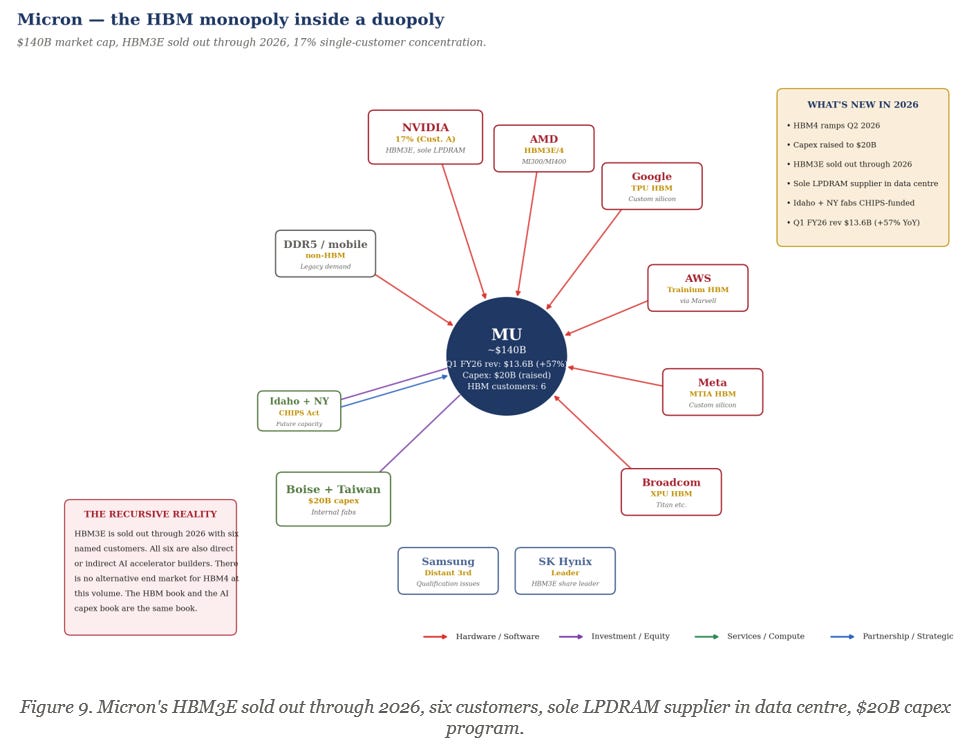
M&A history
Micron’s M&A history is, atypically for the SOXX top ten, minimal. The Numonyx acquisition in 2010 brought NOR flash and PCM technology. The Elpida acquisition in 2013 (two point five billion dollars) made Micron the third memory player after Samsung and SK Hynix. The Inotera consolidation in 2016 brought full ownership of the Taiwan DRAM joint venture. The company has been disciplined about staying out of large transformative M&A and has instead invested in organic capacity. The current capex program is twenty billion dollars in FY26, raised twice during the year as HBM demand exceeded expectations. CHIPS Act funding supports new fabs in Idaho (Boise) and New York (Clay), though the New York build has been deferred multiple times.
HBM (High Bandwidth Memory) monopoly economics
Micron is the smallest of three HBM suppliers but punches above its share. SK Hynix is the HBM3E volume leader at approximately fifty percent share. Samsung has struggled with HBM qualification, particularly for NVIDIA’s H200 and B100 platforms, opening share for both Micron and SK Hynix. Micron’s HBM3E is sold out through 2026 per management commentary on the FY26 Q1 earnings call, with allocations committed to six customers. The HBM4 ramp begins Q2 2026. The 10-K customer concentration disclosure shows the picture in stages: no customer accounted for ten percent or more of revenue in FY23; one customer was ten percent in FY24; one customer was thirteen percent in Q1 FY25 (the most recent quarterly disclosure available). The thirteen percent customer is widely understood by sell-side analysts to be NVIDIA, an attribution that is not formally disclosed in the filing. Analyst estimates project this customer’s share rising to seventeen percent or higher through FY26 as HBM3E volume ramps, but seventeen percent is a forward analyst figure, not a currently disclosed number. The Q1 FY26 revenue of thirteen point six billion dollars, up fifty seven percent year over year, is disclosed.
LPDRAM in data centre
The under-discussed Micron story is LPDRAM penetration in data centre. Micron is currently the sole supplier of qualified LPDRAM for AI inference platforms, a position that Samsung is working to break but has not yet broken. The LPDRAM dynamic is strategically important because inference workload growth outpaces training workload growth, and inference is more memory bandwidth constrained than memory capacity constrained. The HBM duopoly is well understood by the market. The LPDRAM monopoly is not. Both are concentrated in the same six customer set: NVIDIA, AMD, Broadcom (for OpenAI Titan), the three hyperscaler in-house silicon programs (Microsoft Maia, Google TPU, AWS Trainium). The end customer concentration of Micron, traced through its direct buyers, is therefore identical to the end customer concentration of NVIDIA and AMD.
Intel: Sovereign equity and the foundry black hole
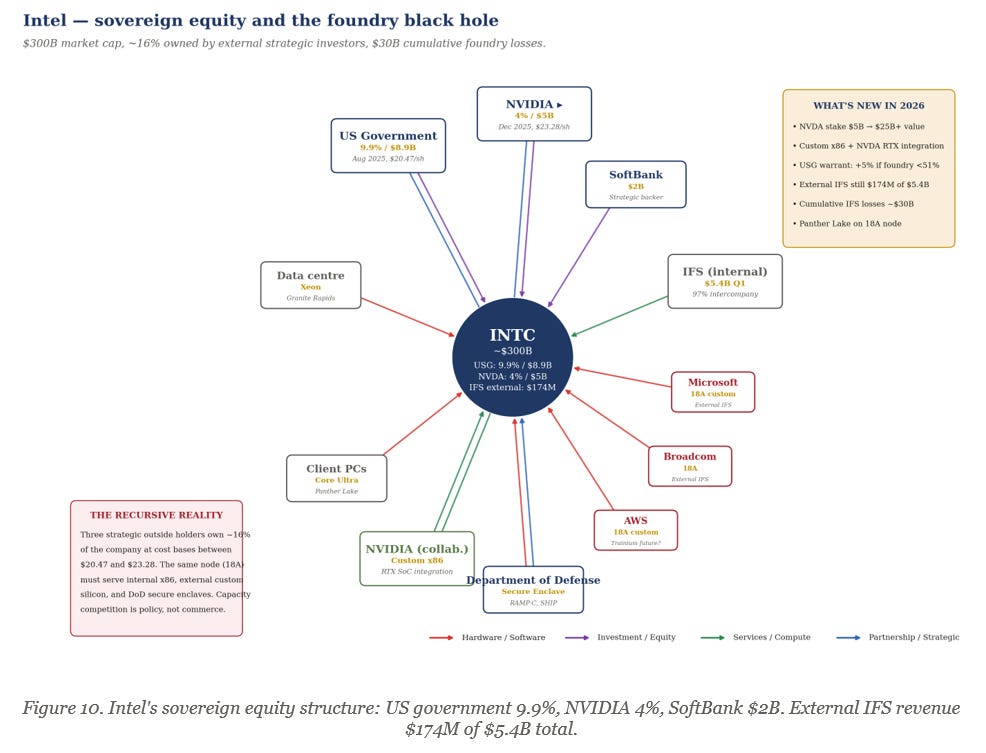
The sovereign equity stack
Intel is the only SOXX top ten holding with a sovereign government as a top-three shareholder. In August 2025 the US federal government acquired approximately a nine point nine percent equity stake by purchasing four hundred and thirty three point three million newly issued shares for approximately eight point nine billion dollars at twenty dollars and forty seven cents per share. The transaction included a warrant that vests an additional five percent if Intel’s ownership of Intel Foundry Services falls below fifty one percent. In December 2025 NVIDIA closed its previously announced five billion dollar investment at twenty three dollars and twenty eight cents per share, acquiring more than two hundred and fourteen point seven million shares for approximately four percent ownership. SoftBank’s two billion dollar investment, announced earlier in 2025, rounds out the external strategic equity at approximately sixteen percent combined. The NVIDIA stake at cost basis of twenty three dollars and twenty eight cents is now worth more than twenty five billion dollars at recent market prices — a historic return for NVIDIA in approximately five months.
The foundry economics
Intel Foundry Services is the central strategic and financial question. Q1 2026 IFS revenue was five point four billion dollars, of which only one hundred and seventy four million dollars (three percent) was external. The remaining ninety seven percent was intercompany revenue from Intel’s product divisions. Cumulative IFS losses over 2023-25 are estimated at thirty billion dollars. External foundry customers disclosed or reported include Microsoft (announced 2024 on 18A), Broadcom (18A custom), AWS (potential Trainium future, unconfirmed), DoD (RAMP-C and SHIP programs), and NVIDIA (custom x86 and RTX system-on-chip integration announced with the equity investment). The Panther Lake client CPU on 18A is the first high-volume product on the new node, ramping in 2026. The 14A node is the strategic make-or-break, scheduled for 2027-28.
The recursive structure
Intel sits inside the AI capex loop but in a different position from the others. It is not selling primarily into the loop, it is being capitalized by it. The same node (18A) must serve internal x86 production, external custom silicon for Broadcom and Microsoft, and DoD secure enclave work. Capacity allocation is a policy decision as much as a commercial one. The USG warrant structure aligns federal interests with Intel maintaining foundry ownership at majority levels, which constrains spin-out optionality. NVIDIA’s four percent stake aligns its interest with Intel’s recovery, but also gives NVIDIA visibility into a competitor’s manufacturing economics that is unprecedented in the modern industry. The basket investor is, through the NVDA cross-holding, paying approximately zero point twenty seven percent of additional Intel exposure beyond the direct INTC weight of six point three eight percent.
Applied Materials: The WFE proxy
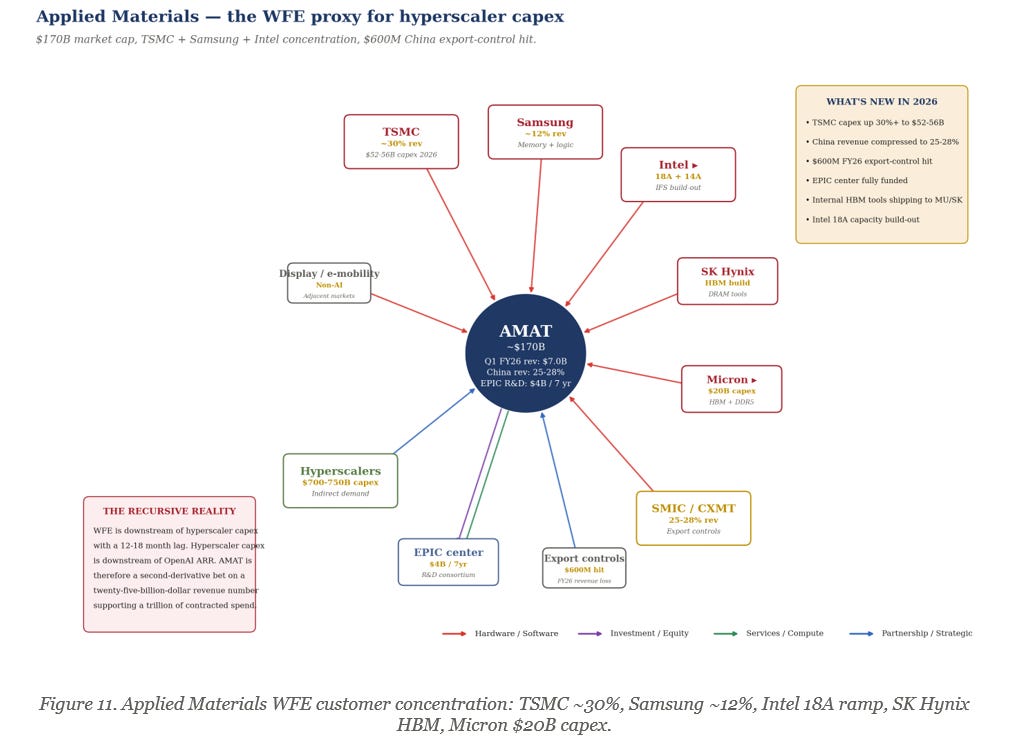
M&A history
Applied Materials has done remarkably little M&A given its scale. The blocked Tokyo Electron merger in 2015 (announced as a twenty nine billion dollar deal, abandoned on US DoJ antitrust grounds) and the blocked Kokusai Electric acquisition in 2021 (announced at three point five billion dollars, abandoned on Chinese SAMR delay) define the history. The lack of M&A reflects both the antitrust environment around WFE consolidation and the company’s organic ability to maintain technology leadership. The EPIC R&D center announced in 2024 represents a four billion dollar, seven year commitment to next-generation lithography and deposition research.
The customer concentration
Applied Materials is the cleanest pure-play on the global wafer fab equipment cycle. Customer concentration is highest among the SOXX top ten outside of MRVL. TSMC is approximately thirty percent of revenue, capex guided at fifty two to fifty six billion dollars in 2026 versus forty point nine billion in 2025. Samsung is approximately twelve percent. Intel 18A is a meaningful and growing customer as the Panther Lake ramp accelerates. SK Hynix HBM capacity expansion drives memory equipment demand. Micron’s twenty billion dollar 2026 capex program adds further demand.
The lag structure
AMAT’s revenue trails hyperscaler capex by twelve to eighteen months because foundry customers must commit to capacity additions before equipment can be ordered. The 2026 AMAT order book therefore reflects the late 2024 to mid 2025 hyperscaler capex announcements, not the most recent acceleration. The risk asymmetry is therefore unusual: a hyperscaler capex pullback today would not affect AMAT revenue until late 2027 or 2028, by which time TSMC capex would already have been deployed. AMAT is therefore the SOXX top ten name with the most option-like exposure to the AI capex cycle. China revenue has fallen from over forty percent of total in 2022 to approximately twenty five to twenty eight percent in 2026, with a six hundred million dollar FY26 revenue hit from new export controls. The China decline is the principal swing factor in AMAT’s near-term growth rate, partially offset by the continued ramp at TSMC and Intel.
Monolithic Power: The hidden AI exposure
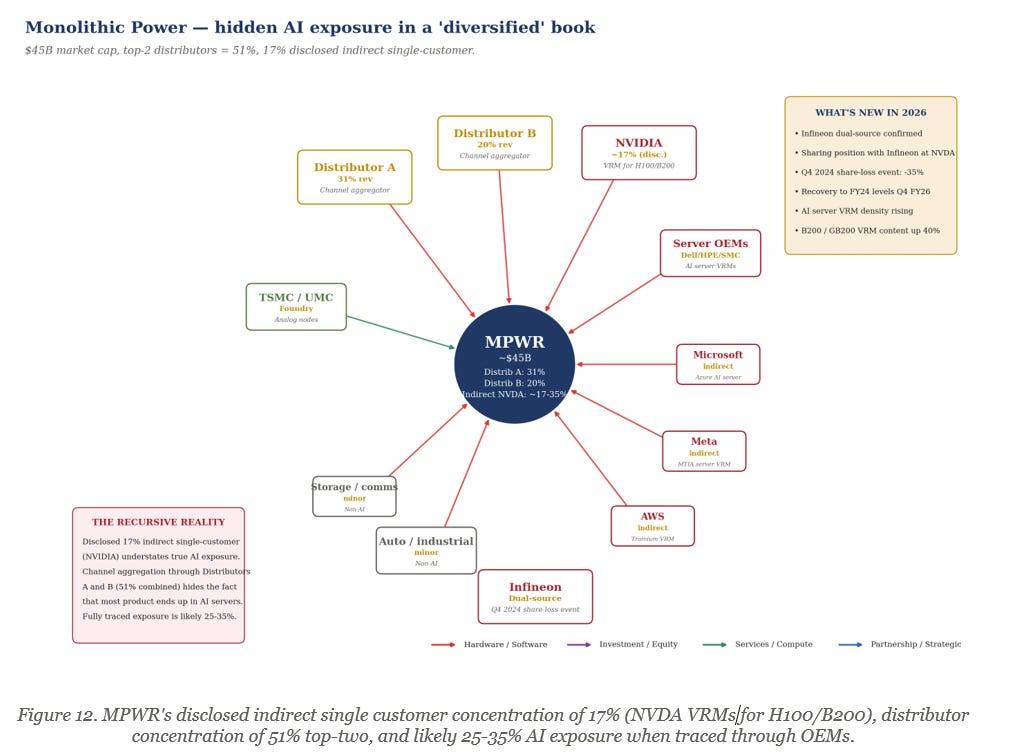
Background
Monolithic Power Systems is the smallest holding in the SOXX top ten by market cap, at approximately forty five billion dollars, and the most idiosyncratic. The company makes power management integrated circuits, principally voltage regulator modules (VRMs) for processors. The strategic position is unusual: MPWR is a fabless company that designs analog power management silicon but does not make digital processors. The customer relationships flow through distributors and OEMs rather than directly to end users.
The disclosed numbers
Distributor A is thirty one percent of revenue, Distributor B is twenty percent. The top two distributors account for fifty one percent of revenue, the highest concentration of any SOXX top ten holding through any channel. The disclosed indirect single-customer concentration through these distributors is seventeen percent, widely understood to be NVIDIA, primarily for VRM content in H100 and B200 server cards. The figure is conservative because traceable AI exposure through the server OEM channel (Dell, HPE, Super Micro) routes back to NVIDIA-based servers deployed by Microsoft, Meta, and AWS. The fully traced AI exposure is most plausibly twenty five to thirty five percent of total revenue, though the company has not disclosed this and analyst estimates vary.
The Q4 2024 share loss event
In late Q4 2024 MPWR stock fell approximately thirty five percent over a four week period on rumors that NVIDIA had dual-sourced VRMs to Infineon for the B200 platform. The rumor was confirmed in 2026 disclosures. Infineon now provides approximately thirty percent of B200 VRM content, with MPWR retaining the remainder. The B200 generation requires forty percent more VRM content per card than the H100 generation, so MPWR’s dollar content per card has increased even as share has declined. GB200 NVL72 systems use approximately one hundred and twenty VRM channels per rack. The mathematics still favor MPWR through the 2026 deployment cycle but the dual-source precedent is structurally important. The Rubin generation (2027) will not assume single-source MPWR.
NXP: The first outsider
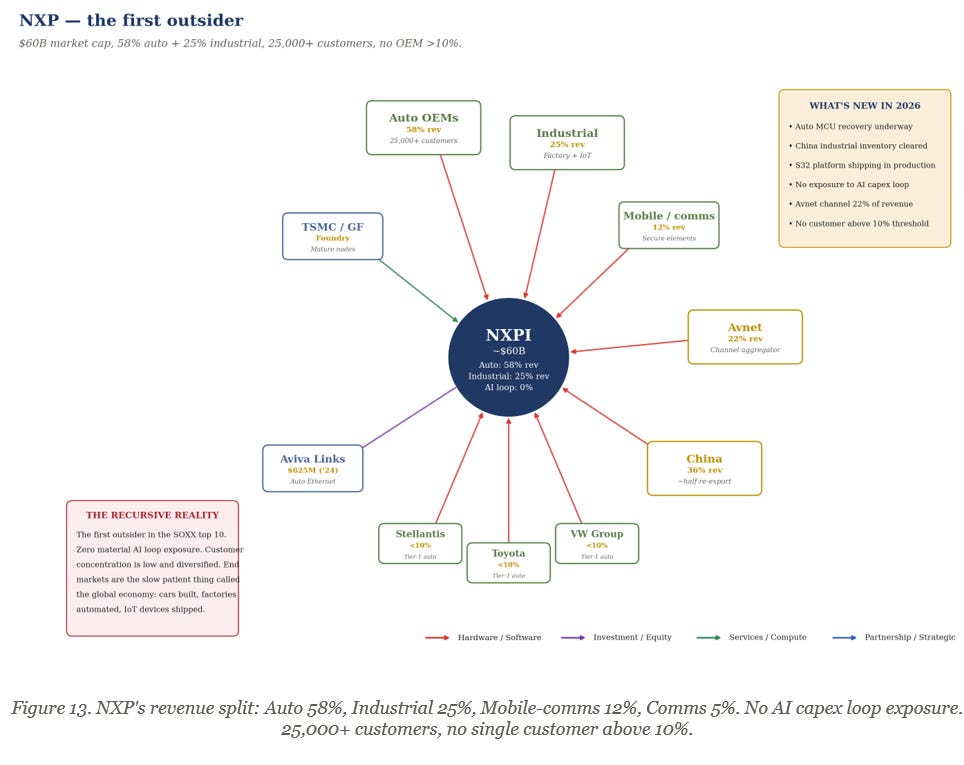
Background
NXP Semiconductors is the first of the two SOXX top ten holdings that sit outside the AI capex loop. The company is the world’s largest dedicated automotive semiconductor supplier by revenue, with a footprint in mobile communications (NFC, secure elements), industrial computing, and communications infrastructure. The failed Qualcomm acquisition in 2018 (forty four billion dollars, abandoned on Chinese SAMR delay) defined the company’s strategic trajectory by forcing it to remain independent. The Aviva Links acquisition in 2024 for six hundred and twenty five million dollars added automotive Ethernet capabilities and is the most consequential M&A of the past three years.
Customer and end-market concentration
NXP has more than twenty five thousand customers globally, with no single OEM accounting for more than ten percent of revenue. Avnet, the distributor, accounts for twenty two percent of revenue as a channel partner, but this represents thousands of underlying end customers. The revenue mix is fundamentally different from the AI-loop names in the SOXX top ten. Automotive is fifty eight percent of revenue, split across power management, microcontrollers, radar, and connectivity. Industrial is twenty five percent. Mobile communications is twelve percent. Communications infrastructure is five percent. The company has zero material AI capex loop exposure.
Geopolitical exposure
China is thirty six percent of NXP revenue, of which approximately half is re-exported in finished goods. The auto inventory correction that began in mid-2023 and bottomed in early 2025 is now in a recovery phase, though the recovery has been slower than expected due to Chinese EV pricing pressure affecting tier-one customers. NXP is, in basket-construction terms, the diversification trade against the AI loop. A passive holder of SOXX is paying approximately three point nine five percent of basket weight for that diversification.
Texas Instruments: The purest hedge
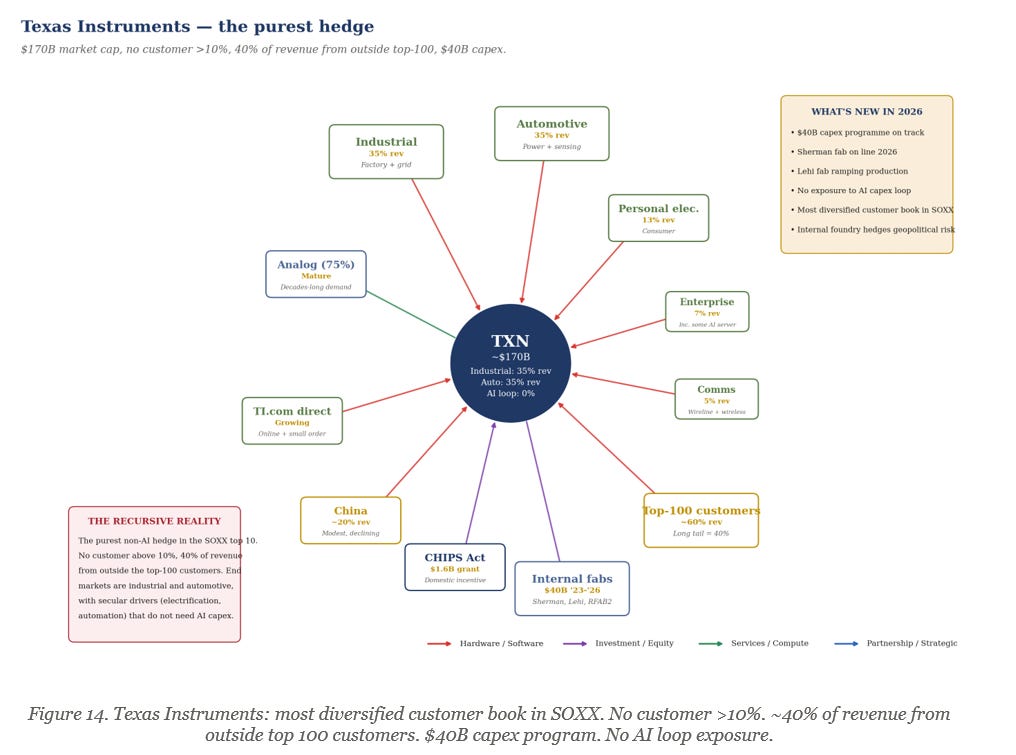
Background
Texas Instruments is the analog incumbent and the second SOXX top ten holding outside the AI capex loop. The company makes analog and embedded processing silicon — power management, signal chain, microcontrollers — across an extraordinarily diversified customer base. TXN’s strategic philosophy under both Rich Templeton (CEO 2004-2023) and Haviv Ilan (CEO 2023-present) has been the opposite of every other company in this article: own as much manufacturing capacity as possible, sell into as many end markets as possible, prefer mature 200mm and 300mm analog process technology over leading-edge logic, and build a customer book where no single customer is structurally significant.
The customer book
Texas Instruments has the most diversified customer book in the SOXX top ten and arguably in the global semiconductor industry. No customer accounts for more than ten percent of revenue. Approximately forty percent of revenue comes from customers outside the top one hundred — the long tail of industrial, automotive, and personal electronics OEMs. Industrial is thirty five percent of revenue. Automotive is thirty five percent. Personal electronics is thirteen percent. Enterprise systems are seven percent. Communications equipment is five percent. The customer concentration profile is the inverse of NVIDIA’s. Where NVIDIA’s top four customers are sixty one percent of revenue, TXN’s top four are likely under fifteen percent combined.
The capex program
The forty billion dollar capex program announced 2022-2026 funds new 300mm analog fabs in Sherman Texas, the Lehi Utah expansion, and the RFAB2 ramp. The capacity build is counter-cyclical: TXN is investing aggressively into a downcycle to capture share in the upcycle. The CHIPS Act provided one point six billion dollars in grants. TXN is its own foundry, internalized end to end, which removes the geopolitical foundry risk that other analog incumbents (NXP, Infineon) face. The combination of zero AI loop exposure, no single customer concentration, internal manufacturing, and counter-cyclical capacity build makes TXN the cleanest defensive position in the SOXX top ten. It is also, by no coincidence, the smallest weight in the basket at three point nine percent.
Where does the cash flow growth actually come from
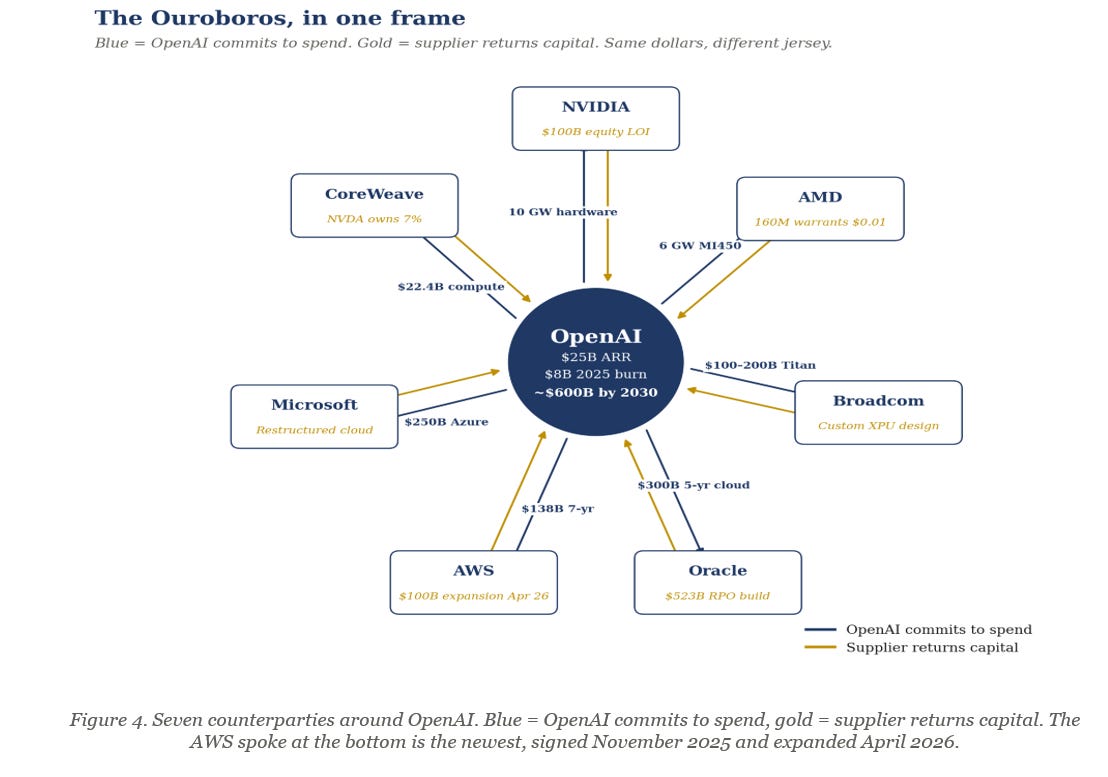
The question implicit in the preceding fifteen exhibits has a precise institutional formulation. Does the internal recycling of capital among AI loop participants — NVIDIA equity into CoreWeave that buys NVIDIA GPUs, Microsoft Azure commitments to OpenAI that flow back as Azure revenue, AMD warrants that vest against Meta MI450 deployments — produce durable external cash flow growth, or does it produce the appearance of growth through accounting and disclosure conventions that obscure the substance?
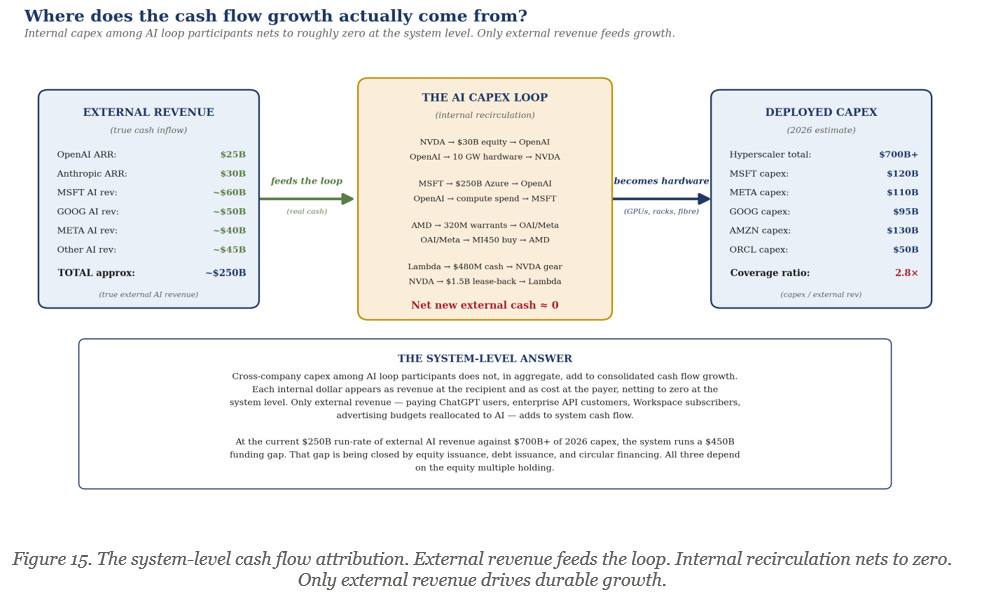
The system level mathematics are sobering. Aggregate 2026 hyperscaler capex across Microsoft, Meta, Amazon, Google, and Oracle is approximately seven hundred to seven hundred and fifty billion dollars. External AI revenue, defined as third-party paying customers buying compute, models, or AI services from these companies and from OpenAI and Anthropic, is approximately two hundred and fifty billion dollars on a run-rate basis. OpenAI ARR is twenty five billion dollars. Anthropic ARR is approximately thirty billion dollars. Microsoft AI revenue is approximately sixty billion dollars. Google is approximately fifty billion dollars. Meta is approximately forty billion dollars (AI-adjacent advertising attribution). Other contributors add roughly forty five billion dollars. The aggregate two hundred and fifty billion divided by seven hundred and fifty billion is a coverage ratio of zero point three three. Said differently, every dollar of hyperscaler capex in 2026 is being supported by thirty three cents of external paying customer revenue.
The four hundred and fifty billion dollar funding gap is closed by equity issuance, debt issuance, and the circular financing structures documented in the per-holding sections. Equity issuance at scale (CoreWeave, Nebius, OpenAI’s structured tender offers) brings external capital into the loop but does not create external revenue. Debt issuance (Oracle’s bond market activity, hyperscaler corporate credit) brings external capital but creates a future cash flow obligation rather than a current cash flow asset. The circular financing structures — NVIDIA equity into customers, AMD warrants, Oracle take or pay agreements — do not bring in external capital at all. They recirculate the suppliers’ own equity through the customers’ income statements.
The institutional question is therefore not whether the loop is working. It is, by construction, working. The question is whether the external revenue line, the only line that can durably support the deployed capex base, will compound at a rate that justifies the current valuations of the SOXX top ten. The historical analog is the late 1990s telecom buildout, where supplier financing of capex from Nortel, Lucent, and Cisco to Worldcom, Global Crossing, and Williams Communications produced apparent demand that did not survive the cessation of the financing. The supplier vendor financing in that cycle peaked at approximately fifteen percent of supplier revenue. The current cycle’s supplier financing, when one includes NVIDIA’s forty billion dollars of equity stakes, AMD’s penny warrants, and Oracle’s RPO buildout, is plausibly already past that level.
Yours, washed ashore
Dear reader, if you have read this far, you have done more work than ninety nine percent of the passive holders of the iShares Semiconductor ETF. The basket has been kind to its holders for fifty-two weeks. The chart looks good. The cocktail party copy is excellent. Several of your friends in technology have made the kind of money that does not normally fit in a Roth IRA. This article is not an argument that any of that should change today, tomorrow, or this quarter.
It is an argument that you should understand what you own. Eight of ten holdings sit inside a closed financial loop where the same dollars are recirculated through equity stakes, warrant grants, take or pay agreements, and forward commitments. Six of ten depend materially on AWS. Five depend on Microsoft. Five depend on Meta. Four depend on OpenAI. Two of ten (Intel and Marvell) have NVIDIA as a strategic equity holder. One of ten (Intel) has the United States federal government as its third largest shareholder. The basket owns itself, at the margin. The growth rate of the basket depends on the external revenue trajectory of OpenAI and Anthropic. The fragility of the basket is proportional to the share of system level capex that is financed through internal recycling rather than external customer revenue.
None of this is fraud. All of it is disclosed in primary filings. The thesis is narrower than fraud and broader than mispricing: it is that the structural features of the basket are not adequately advertised by the basket label or by the consensus framing, and that an investor with a fiduciary obligation, a long memory of the 1999-2002 telecom buildout, or simply a desire to know what they own, deserves to see the structure rendered in pictures.
That is what this article attempts to do. Whether the thesis is correct will be settled by the OpenAI revenue trajectory over the next twelve to twenty four months, by the next two NVIDIA 10-Q filings (Q1 FY27 in late August 2026 and Q2 FY27 in late November 2026), by the AMD penny warrant vesting milestones, and by the hyperscaler capex disclosures for 2027 that will begin to appear in Q4 2026 earnings calls. Until then, the loop continues, the basket compounds, and the careful investor watches the external revenue line and treats every disclosed cross-financing structure as a piece of evidence.
“You never know who is swimming naked until the tide goes out.”— Warren Buffett, 2001 Berkshire Annual Letter, on telecom vendor financing
This document represents the personal views and analytical opinions of the author at the time of publication. It is not investment advice, a recommendation, or a solicitation to buy, sell, or hold any security. The author maintains disclosed positions in certain securities discussed herein and may add to, reduce, hedge, or close those positions at any time without notice. No representation or warranty is made as to the accuracy or completeness of the information presented. Forward-looking statements are inherently uncertain and past performance is not indicative of future results. Readers are solely responsible for their own due diligence, position sizing, and investment decisions, and should consult qualified investment, legal, and tax professionals before acting on any information contained herein.