Float Machines, Capital Allocators & Infinite Compounders
How Insurance Float, Crisis Capital Allocation, and Patient Holding Built the Greatest Compounding Machines in Financial History

The Float Machine Architecture
The Mechanics: How Insurance Float Creates Permanent Capital
Insurance float is money an insurer holds but does not own. Policyholders pay premiums upfront; claims are settled months, years, or decades later. The gap creates an investable pool that functions as interest-free, perpetual leverage—superior to bank loans (which must be repaid), bonds (which mature), or equity (which dilutes). For a growing insurer with underwriting discipline, the float pool either holds steady or expands every year, creating what Buffett has called “better than free money.”
The critical insight—articulated in Buffett’s 1997 shareholder letter—is that an insurance business has value if its cost of float over time is less than the cost the company would otherwise incur to obtain funds. When the insurer achieves an underwriting profit (premiums collected exceed claims paid), the cost of float is negative—the company is literally being paid to hold other people’s money. Berkshire achieved this for 11 consecutive years from 2003 to 2013, generating $22 billion in cumulative underwriting profits while simultaneously growing float from $41 billion to $77 billion.
The Float Leverage Ratio: A landmark study by Frazzini, Kabiller, and Pedersen—first published as an NBER working paper in 2013 and later in the Financial Analysts Journal (Vol. 74, No. 4, 2018)—rigorously decomposed Buffett’s returns. The findings are precise and worth stating accurately. Berkshire achieved a Sharpe ratio of 0.79—the highest among all U.S. stocks and mutual funds with a history of more than 30 years. That is, by any measure, an extraordinary risk-adjusted track record. The authors estimated that Buffett applied approximately 1.7-to-1 leverage on average, funded partly through insurance float at a very low financing rate, as well as through other sources such as deferred tax liabilities and derivatives. Crucially, when the authors controlled for exposure to two specific factors—“betting against beta” (buying safe, low-volatility stocks) and “quality minus junk” (buying profitable, stable, growing companies)—the alpha to traditional risk factors became statistically insignificant. The paper’s conclusion was not that Buffett’s stock-picking was unremarkable, but rather that his style can be characterised by a systematic preference for cheap, safe, high-quality stocks—and that applying consistent leverage to this style over six decades produced the best compounding record ever documented. The float was central to this architecture: it provided the low-cost, stable leverage that allowed the style to compound without the forced liquidation risk that destroys leveraged strategies during drawdowns. Without this structural advantage, the same stock selection applied without leverage would have produced strong but far less spectacular results.
Berkshire’s Float: From $17 Million to $176 Billion
The Complete Float Growth Timeline (1967–2025)
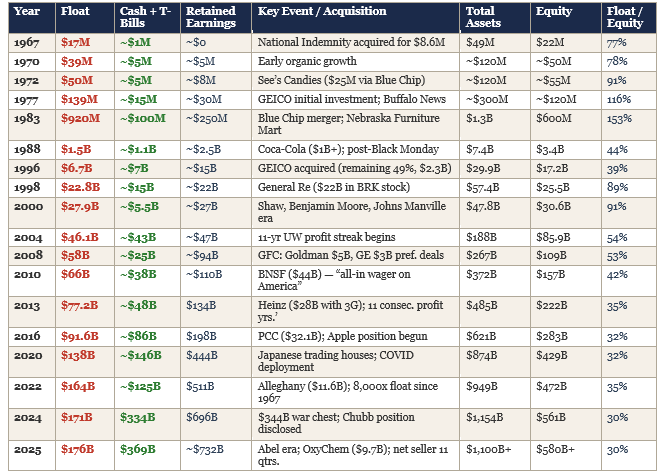
Key Observation — The Capital Stack Evolution: Three numbers in this table tell the entire Berkshire story. First, the float-to-equity ratio peaked at 153% in 1983 (when insurance float actually exceeded shareholders’ equity) and has since declined to approximately 30% as retained earnings have dwarfed the float. In the early decades, float was the dominant source of investable capital. Today, accumulated retained earnings of $732 billion dwarf the $176 billion float by 4:1. Second, the Cash + T-Bills column reveals Buffett’s crisis readiness. By year-end 2025, Berkshire held $369 billion in cash and Treasury bills—more than double the float itself—after being a net seller of equities for 11 consecutive quarters. This war chest, funded by decades of retained operating earnings from See’s, GEICO, BNSF, and dozens of other businesses, gives Berkshire unmatched firepower for the next crisis. Third, the Retained Earnings column shows the compounding flywheel in action: Berkshire has never paid a dividend since 1967, meaning every dollar of earnings from every business and every investment has been reinvested inside the structure. The retained earnings grew from effectively zero in 1967 to $732 billion by 2025—a figure that represents the cumulative cash generated by float-funded investments, reinvested over 58 years. The float machine built the base; the compounding of retained business earnings now drives the growth. But without the float to fund the original acquisitions, none of those retained earnings would exist.
Note: Pre-1996 cash and retained earnings figures are estimates derived from annual reports and secondary sources. Post-1996 figures are from SEC filings. “Cash + T-Bills” includes cash, cash equivalents, and short-term investments in U.S. Treasury bills—what Buffett refers to as Berkshire’s “war chest.” Retained earnings represent cumulative net income not distributed as dividends since 1965.
National Indemnity (1967): The $8.6 Million Launchpad
Balance Sheet Context: Berkshire’s total assets were approximately $49 million, with shareholders’ equity around $22 million. The company was bleeding cash from its textile operations, generating low single-digit returns on equity. Buffett’s primary motivation was redeploying textile cash flows into a higher-ROE business.
The Acquisition Logic: National Indemnity wrote $12.7 million in premiums with $17 million in float, invested conservatively in bonds. For $8.6 million—of which only $6.7 million represented Buffett’s equity (the remainder covered tangible assets)—Buffett gained control of $17 million in deployable capital. He immediately began redirecting the float into higher-returning equities. The company’s decade-long track record showed 21% premium growth, 15% net income growth, and an 11% average ROE under founder Jack Ringwalt, whose underwriting discipline Buffett preserved religiously.
The Discipline That Made It Work: Between 1986 and 1999, National Indemnity’s premium volume ranged from $366 million to just $55 million—the company walked away from 85% of its business when pricing was inadequate. No publicly traded insurer with quarterly earnings pressure would tolerate this. Buffett could, because Berkshire’s diversified earnings base meant insurance profitability was a choice, not a necessity. This structural advantage—the ability to say “no” when competitors must say “yes”—is the single most important competitive advantage in insurance.
GEICO (1951–1996): The 45-Year Courtship
Phase 1 — Discovery (1951): Twenty-year-old Warren Buffett visited GEICO’s Washington D.C. offices on a Saturday, spending four hours with Lorimer Davidson learning the business. He recognised the structural cost advantage: by eliminating agents, GEICO could offer 15–20% lower premiums while maintaining superior profitability. He invested $10,282 of his $20,000 net worth.
Phase 2 — Crisis Purchase (1976): GEICO nearly went bankrupt due to inadequate reserving. The stock collapsed from $61 to $2. Buffett began buying at approximately $2 per share, eventually accumulating a 33% stake for roughly $47 million. By 1980, the stake was worth $105 million—a 2.2x return in four years. But the real value was the growing float as GEICO recovered and expanded under new management.
Phase 3 — Full Acquisition (1996): Berkshire paid $2.3 billion for the remaining 49%, valuing the company at approximately $4.7 billion. At the time, GEICO was America’s fifth-largest auto insurer. Berkshire’s balance sheet showed $29.9 billion in total assets with $17.2 billion in equity. The deal gave Buffett complete control over GEICO’s rapidly growing float and its direct-to-consumer cost moat. Today GEICO is the second-largest U.S. auto insurer behind State Farm, with float growing continuously for three decades.
General Re (1998): The $22 Billion Lesson in Using Stock as Currency
Buffett paid for General Re entirely in Berkshire Class A shares valued at $58,400 each. The deal added $15 billion in float overnight and gave Berkshire a global reinsurance platform. However, Buffett later acknowledged significant problems: Gen Re had underwriting issues that took years to fix, and the Berkshire shares used in payment appreciated far beyond what the deal’s economics warranted. Those shares would be worth multiples of the original value today. The lesson—which Buffett cited repeatedly alongside the Dexter Shoe disaster—is that using stock as acquisition currency is extremely dangerous when the stock is undervalued. Cash preserves optionality; stock is a permanent claim on future earnings.
Beyond Berkshire: The Global Float Machine OperatorsPrem Watsa’s Fairfax Financial: The Canadian Berkshire (18.9% CAGR)
Origin Story: In 1985, Prem Watsa—an Indian immigrant who had arrived in Canada in 1972 with $8 in his pocket—met Francis Chou, who explained how Buffett made his money through investing Berkshire’s insurance float. Watsa immediately acquired a nearly bankrupt Canadian trucking insurer, renamed it Fairfax Financial, and began executing the Berkshire playbook: tighten underwriting, generate reliable float, invest the proceeds in undervalued assets. His first job after earning his MBA from the Ivey Business School had been at Confederation Life, where a director handed him a copy of Security Analysis. That single book—Graham and Dodd’s foundational text—became the intellectual bedrock of a $100 billion asset empire.
The CDS Masterstroke (2007–2008): Fairfax’s most spectacular investment was a massive bet against the U.S. housing market using credit default swaps—what The Fairfax Way later called the “(even) Big(ger) Short.” Beginning in 2003, Watsa and his team—led by bond specialist Brian Bradstreet, the trade’s chief architect—conducted forensic analysis of subprime mortgage securities and concluded that default rates were being systematically understated by rating agencies and underwriters. The CDS book ultimately reached a notional amount of $18.5 billion across approximately 25–30 companies—mostly bond insurers and mortgage lenders—with a total acquisition cost of just $344 million. Before the payoff arrived, the positions lost heavily, and Bradstreet later acknowledged that at any other firm, he would have been fired. As Watsa recalled: “We thought it would happen in 2005, 2006, 2007…” When the housing market finally collapsed, Fairfax made close to US$4.2 billion on the total strategy—including the CDS gains, equity hedges, and related defensive positions. This was transformational: Fairfax’s common shareholders’ equity base grew from $4.1 billion to $7.4 billion during 2008–2009, an increase of $3.3 billion and a 61% gain in book value per share. The trade was worth more than Fairfax’s entire market capitalisation at the time and burying any lingering financial-strength concerns. It demonstrated that the insurance float model works not just for long-term equity investing but for any contrarian position where the investor has a genuine informational edge and the patience to endure years of unrealised losses before the thesis plays out.
The India Thesis: Watsa’s most distinctive contribution has been building a deep India investment platform. Through Thomas Cook India (acquired 2012 for 77%), Fairfax gained access to India’s travel market. Thomas Cook India then invested $47 million in Quess Corp, a staffing company, in 2013. Quess grew explosively—Thomas Cook sold 5.4% for $97 million while retaining a 49% stake that peaked at over $1 billion in value. This single investment—$47 million turning into $1 billion+—exemplifies the float machine at work: insurance float funded the Thomas Cook acquisition, which funded the Quess investment, which generated a 20x+ return. Separately, Fairfax India (a permanent capital vehicle) invested in IIFL Group, where after-tax profits grew at over 30% annually. Watsa’s 2023 letter stated that the opportunity in India is unparalleled. Digit Insurance, a tech-driven insurer Fairfax backed from startup, grew to $1 billion in premiums—creating a modern float machine within the larger float machine.
Where Watsa Stumbled: From 2010 to 2016, Watsa maintained large equity short positions and hedges, costing approximately $2 billion. Book value compounded at just 2.1% over those six years. He acknowledged the error in his 2019 letter, attributing it to too many short positions. The insurance underwriting remained consistently profitable (sub-100% combined ratio since 2006), but the investment side suffered when Watsa departed from pure value investing toward macro hedging. Fairfax’s BlackBerry investment—convertible debt and equity bought in 2013 on a turnaround thesis—also generated significant losses as the smartphone disruption proved structural, not cyclical. Since unwinding the shorts and refocusing, Fairfax delivered record net earnings of $4.4 billion in 2023, driven by $1.5 billion in underwriting profit.
Tom Gayner’s Markel Group: The 250-Bagger Plodder
The Model: Markel operates a three-engine structure mirroring Berkshire in miniature. Engine 1: specialty insurance underwriting generates float from hard-to-place risks where standard insurers won’t compete. Engine 2: a $12.5 billion public equity portfolio managed by Gayner with just 1% annual turnover—128 stocks including Berkshire itself as the largest position (13% of portfolio), plus Alphabet, Deere, Home Depot, and Brookfield. Engine 3: Markel Ventures, a collection of 20+ wholly-owned businesses (AMF baking equipment, houseplants, construction services) that provide stable cash generation independent of the insurance cycle.
Gayner’s Four-Part Discipline: Articulated in Markel’s 2019 letter, Gayner’s framework is: (1) businesses earning good returns on capital with modest leverage, (2) management teams with equal measures of talent and integrity, (3) opportunities to reinvest capital and grow, and (4) fair prices. He explicitly echoes Buffett’s observation that being an investor makes him a better businessman, and being a businessman makes him a better investor. This 360-degree view of capital allocation—seeing private businesses in flesh and blood while also evaluating public securities—creates an information advantage that pure stock pickers lack.
The “Orange and Blue” Intrinsic Value Framework: Gayner developed a proprietary valuation methodology for Markel itself. The “Orange” component is the per-share value of the investment portfolio. The “Blue” component is a normalised multiple applied to operating income from underwriting, non-underwriting insurance, and Ventures businesses. Added together, they produce Gayner’s estimate of intrinsic value per share. At year-end 2024, he estimated intrinsic value at $2,610 versus a stock price of $1,726—a 34% discount. When Orange + Blue exceeds market price by a wide margin, Markel repurchases shares aggressively. This discipline—buying your own stock only when it trades at a genuine discount to intrinsic value—is precisely the framework Graham taught in Chapter 8 of The Intelligent Investor.
Apollo/Athene: The Private Equity Float Machine ($300B+ AUM)
The Innovation: Apollo represents the modern evolution of the float concept. Founded in 2009 during the GFC, Athene collects long-duration annuity liabilities—life insurance float rather than P&C float—and invests them in private credit assets originated by Apollo’s platform. The critical distinction: Buffett uses short-duration P&C float to fund equity investments because equities are liquid and can be sold if claims surge. Apollo uses long-duration annuity float (policyholders won’t claim for 20–30 years) to fund illiquid private credit—CLOs, asset-backed securities, direct lending—where the illiquidity premium generates 150–300bps of excess return over public credit.
The LyondellBasell Case Study: Apollo’s most spectacular crisis purchase occurred during the GFC when the chemical company LyondellBasell filed for bankruptcy. Apollo funds bought distressed debt at deep discounts, positioning for a debt-for-equity conversion. When the company emerged from bankruptcy and recovered, Apollo’s position generated multi-billion-dollar profits. This is the same playbook Buffett used with Fruit of the Loom (bought from bankruptcy for $835 million in 2002) and Watsa used with multiple distressed Canadian insurers—the only difference is the instrument (distressed debt vs. equity) and the funding source (PE fund capital vs. insurance float).
The Scale Problem: By 2024, Apollo managed over $300 billion in insurance-related assets, with a 10:1 asset-to-equity leverage ratio. KKR followed by acquiring Global Atlantic. An estimated 70–80 registered asset managers have set up insurance or reinsurance companies in the past decade. This proliferation validates Buffett’s 1967 insight but also raises systemic risk questions: when dozens of firms are using insurance float to fund illiquid alternative credit, a simultaneous liquidity crunch could create the kind of cascading failure that Buffett and Munger have warned about with derivatives as “financial weapons of mass destruction.”
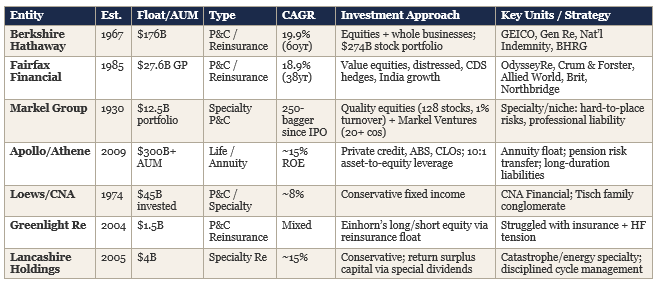
Float-Funded Investment Vehicles — Global Comparison

Capital Allocation — Fire Sales, Crisis buying & Lessons from Failure
The Complete Berkshire Acquisition Record
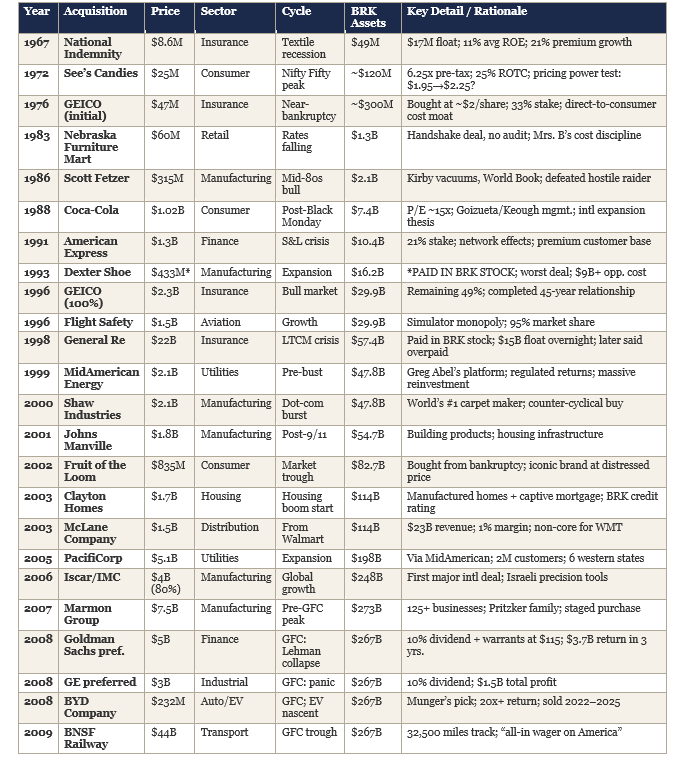
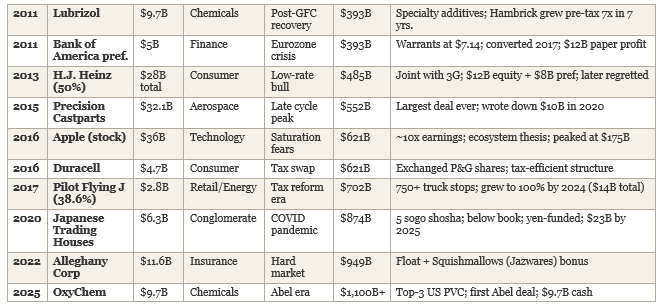
Every Major Berkshire Acquisition with Balance Sheet Context & Rationale
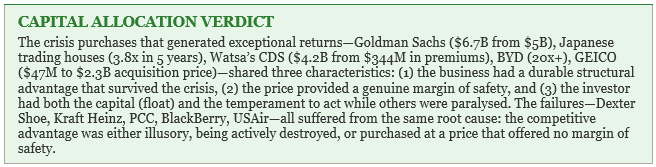
The Crisis Buyer’s Playbook: How Exceptional Returns Are Generated
When we map every major investment by Buffett, Watsa, and Gayner against market cycles, the pattern is unmistakable: the largest, most profitable investments were initiated during the 12–18 months following a crash or severe recession. This is not contrarianism for its own sake. It is the mathematical consequence of buying durable businesses at prices that provide a genuine margin of safety—and having the float-funded capital to act when others are frozen.
Case Study 1: Buffett’s 2008 Crisis Deployment ($14.5B in 90 Days)
The Setup: September 2008. Lehman Brothers collapsed on the 15th. The S&P 500 fell 57% peak to trough. Credit markets froze completely. The U.S. government injected hundreds of billions into the banking system. Berkshire’s balance sheet showed $267 billion in total assets, $109 billion in equity, $58 billion in float, and approximately $24 billion in cash and equivalents.
Goldman Sachs ($5B, 23 September 2008): Just two days after Goldman became a bank holding company, Berkshire invested $5 billion in special preferred shares paying 10% annually ($500 million per year) plus warrants to buy $5 billion of common stock at $115 per share. The structure gave Buffett guaranteed downside protection (the preferred dividend) with unlimited upside participation (the warrants). When Goldman redeemed the preferred in 2011, Berkshire had earned $3.7 billion in total returns including $1.27 billion in dividends plus $1.64 billion in one-time redemption premium. Buffett subsequently converted the warrants into 13.1 million shares of common stock worth over $3 billion. Total return on a $5 billion investment: approximately $6.7 billion in under five years.
GE ($3B, October 2008): Identical structure—preferred stock with 10% dividend—generated approximately $1.5 billion in total profit. As Buffett wrote in his October 2008 New York Times op-ed: “A simple rule dictates my buying: Be fearful when others are greedy, and be greedy when others are fearful.” His cash commitment during the crisis totalled $14.5 billion. He sold portions of Johnson & Johnson, Procter & Gamble, and ConocoPhillips to fund the deals—selling good assets to buy extraordinary ones at crisis prices.
The Investment Philosophy At Work: Buffett’s crisis playbook combined three principles simultaneously: (1) Graham’s margin of safety—even if Goldman struggled further, the 10% preferred dividend provided acceptable returns; (2) the preferred + warrants structure from Security Analysis—a hybrid instrument offering downside protection with upside participation; and (3) the temperamental advantage Cialdini describes in Influence—while the entire market was experiencing social proof bias (everyone selling because everyone else was selling), Buffett acted on his own analysis. The float—$58 billion of cost-free capital—gave him the financial capacity to act. The temperament gave him the psychological capacity.
Case Study 2: Watsa’s CDS Windfall ($4.2B from $344M in Premiums)
The Setup: 2006–2007. Fairfax’s team analysed the U.S. subprime mortgage market and concluded that default rates on adjustable-rate mortgages were being systematically understated by rating agencies and underwriters. The analysis was forensic—examining actual loan-level data, teaser rate expiration schedules, and borrower qualification standards—the same methodology Howard Schilit advocates in Financial Shenanigans for detecting accounting manipulation.
The Trade: Beginning in 2003, Fairfax purchased credit default swaps on companies with heavy exposure to mortgage-backed securities—bond insurers and mortgage lenders—at a total cost of just $344 million. The CDS book reached a notional amount of $18.5 billion across 25–30 names. Before the payoff, the positions hemorrhaged money for years; the team endured mounting paper losses and shareholder criticism. Watsa told shareholders in his 2006 letter: “Some of you wondered—sometimes loudly—why we bother with these hedges and credit default swaps.” When the housing market finally collapsed in 2007–2008, the total strategy—CDS gains, equity hedges, and related defensive positions—generated close to US$4.2 billion in gains. Fairfax’s equity base surged from $4.1 billion to $7.4 billion, a 61% gain in book value per share. This single strategy was worth more than Fairfax’s entire market capitalisation at the time, transforming the company’s balance sheet and burying the financial-strength concerns that had plagued it for years.
Why It Worked: Watsa’s edge was not market timing but analytical rigour. His team didn’t guess that housing would collapse—they calculated that the securities were mispriced relative to their actual default risk. This is the Graham-Dodd approach applied to modern structured credit: buying (or selling) assets whose market price diverges meaningfully from intrinsic value. The insurance float provided the capital. The analytical framework provided the conviction. The patience to hold through mounting paper losses (the CDS positions lost money for over a year before paying off massively) required the same temperament Buffett describes in his favourite holding period analogy.
Case Study 3: Japanese Trading Houses ($6B → $23B in Five Years)
The Setup: 2020. COVID pandemic. The yen was weak. Five Japanese sogo shosha—Itochu, Marubeni, Mitsubishi, Mitsui, Sumitomo—traded at massive discounts to book value, typically 0.5–0.8x book. These conglomerates are essential intermediaries in Japan’s industrial ecosystem, handling everything from commodities to infrastructure to consumer products. They had durable competitive advantages as deeply embedded middlemen—positions as irreplaceable as a railroad’s right-of-way.
The Execution: Buffett took equal 5% positions in all five companies, investing approximately $6.3 billion funded partly with yen-denominated borrowings—a natural currency hedge that reduced risk. This was a rare international bet: Buffett had historically avoided non-U.S. investments, but the valuation gap was too wide to ignore. Within five years, the position grew to approximately $23 billion (3.8x return). Berkshire has since increased its ownership to 8–9% of each company.
The Multiple Framework Applied: This trade combined at least four investment frameworks: Graham’s quantitative margin of safety (below book value), Fisher’s qualitative analysis (durable competitive positions in essential industries), the Outsiders framework (these companies had proven capital allocators returning capital through dividends and buybacks), and Munger’s multi-disciplinary thinking (understanding Japanese corporate culture, currency dynamics, and geopolitical positioning simultaneously). The yen-funded hedge added a fifth dimension—Buffett was borrowing at near-zero Japanese interest rates to buy companies yielding 3–4% in dividends alone, creating a positive carry before any capital appreciation.
Fire Sales That Failed: The Post-Mortem
Dexter Shoe (1993): The $9 Billion Lesson
Buffett paid $433 million in 25,203 Berkshire shares for a Maine shoe manufacturer whose competitive advantage—domestic production—was destroyed by Asian imports. The business became worthless. Those Berkshire shares are now worth over $9 billion. Buffett has repeatedly flagged this as his worst deal, noting two compounding errors: first, the competitive advantage was not durable (Asian manufacturers could produce identical shoes at a fraction of the cost); second, he used Berkshire stock as currency, multiplying the cost of the error by the subsequent appreciation. The lesson is permanent: never use stock to buy a business with a fragile moat, and never assume that a current competitive advantage will persist without forensic analysis of potential disruptors.
Kraft Heinz (2013–2015): When Cost-Cutting Destroys Brands
The $28 billion joint deal with 3G Capital was Buffett’s most significant departure from his own principles. 3G’s zero-based budgeting slashed costs aggressively—but also eroded brand investment, product quality, innovation pipelines, and employee morale. The stock declined over 70% from its merger-era peak. In January 2026, Berkshire under Greg Abel initiated a process to exit the 27.5% stake. The failure connects directly to Buffett’s own 1972 letter to See’s Candies CEO: never sacrifice quality for profit. The brand is the asset. When you cut the investment sustaining the brand, you destroy the very thing you paid a premium for. This was also a failure of the Outsiders framework: 3G were brilliant cost-cutters but terrible brand stewards. Capital allocation skill without brand stewardship is destructive in consumer businesses.
Precision Castparts (2016): The Cycle-Peak Error
At $32.1 billion, this was Berkshire’s largest-ever acquisition. PCC makes castings and forged components found in virtually every commercial aircraft. The business is excellent—high barriers to entry, essential products, long-term contracts with Boeing and Airbus. But Buffett bought at the peak of the aerospace cycle when order books were at record levels. When COVID devastated commercial aviation in 2020, Berkshire wrote down $10 billion. Buffett admitted in the 2020 letter that he overpaid. The lesson: even wonderful businesses can be terrible investments at the wrong price. Graham’s margin of safety concept applies not just to mediocre companies trading below liquidation value, but also to great companies trading above fair value.
Watsa’s BlackBerry (2013): The Turnaround That Wasn’t
Fairfax invested in BlackBerry through convertible debt and equity, betting that CEO John Chen could pivot the company from smartphones to enterprise software and cybersecurity. The thesis—that BlackBerry’s patent portfolio and enterprise security capabilities had underappreciated value—was intellectually coherent but ultimately wrong. The smartphone disruption was structural, not cyclical. The patents generated modest licensing revenue but never replaced the lost handset business. The lesson: in technology, disruption at a strategic inflection point is usually permanent. A business model that has been structurally obsoleted cannot be turnarounded into its prior economics regardless of management quality.

Infinte Compounders — The Forever Hold
The most powerful concept in the float-funded investment model is not buying cheap stocks or timing crises. It is the recognition that certain businesses, once acquired at reasonable prices, should never be sold. These “infinite compounders” generate returns that accelerate over time because their competitive advantages strengthen with scale, and the tax-free deferral of unrealised gains creates a compound-within-a-compound effect.
The Financial Evidence: See’s Candies as Prototype
Acquisition (1972): $25 million for a business with $8 million in net tangible assets, $31 million in revenue, and $4 million in pre-tax profits. Price: 6.25x pre-tax earnings, 3.1x net tangible assets. Buffett nearly walked away—the seller wanted $30 million and Buffett’s maximum was $25 million. Charlie Munger and Ira Marshall argued that See’s 25% after-tax return on tangible capital indicated extraordinary economics that justified paying above book value—a dramatic departure from Graham’s cigar-butt philosophy.
The Pricing Power Thesis: Buffett’s key analytical question: could the $1.95 box of candy sell for $2.25? If so, the additional $0.30 per pound on 16 million pounds would generate $4.8 million in extra earnings—more than justifying the acquisition price. He later explained: “Can you imagine going home on Valentine’s Day and saying, ‘Honey, this year I took the low bid’? It just isn’t going to work.” Price per pound rose from $1.95 to $5.42 by 1983 and over $22 by 2020. Physical volume grew at barely 2% annually for 50 years—but financial returns were extraordinary.
The Cumulative Result: By 2007, See’s had generated $1.35 billion in cumulative pre-tax profits on just $32 million of incremental capital reinvestment. By 2024, cumulative pre-tax profits exceeded $2 billion. The capital required to run the business was just $40 million in 2007. This means See’s earned its entire $25 million purchase price back within the first decade, then generated 80x the purchase price in cumulative earnings over five decades—all while requiring almost no reinvestment. Every dollar of See’s earnings was sent to Omaha and redeployed into Coca-Cola, BNSF, Apple, and dozens of other investments.
The Lesson That Changed Everything: Munger later said: “When we bought See’s, we didn’t know the power of a good brand. Over time we discovered that we could raise prices 10% a year and no one cared. Learning that changed Berkshire. It was really important.” This single insight—that a brand with consumer loyalty can raise prices indefinitely without losing demand—directly inspired the Coca-Cola investment sixteen years later, the Apple investment four decades later, and the entire conceptual framework of paying fair prices for wonderful businesses rather than wonderful prices for fair businesses.
The Coca-Cola Compounding Machine (37+ Years, Never Sold)
Entry (1988–1994): Buffett spent $593 million in 1988 (post-Black Monday, P/E ~15x), $431 million in 1989, and $275 million in 1994, for a total cost of $1.3 billion across 400 million split-adjusted shares. At entry, Coca-Cola was recovering from the New Coke debacle under CEO Roberto Goizueta, who was aggressively expanding into international markets and repurchasing shares. Buffett’s 1988 letter announced: “We expect to hold these securities for a long time. In fact, when we own portions of outstanding businesses with outstanding managements, our favourite holding period is forever.”
The Compounding: Coca-Cola’s annual dividend was $0.075 per share in 1988. By 2024, it had grown to $1.94 per share. Berkshire now earns approximately $776 million annually in dividends—roughly 60% of its original per-share cost basis, every year. The position has never had a single share sold in 37+ years. At current prices (~$70/share), the 400 million shares are worth approximately $28 billion on a $1.3 billion cost basis—a 2,054% return before dividends. Including accumulated dividends received over 37 years, the total return exceeds 3,000%.
Why It Compounds Forever: Coca-Cola’s brand exists in consumers’ minds, not on a balance sheet. It requires minimal tangible capital to maintain. The company can raise prices annually because the product occupies a unique psychological position. International expansion provided decades of volume growth. Share buybacks reduced the denominator, increasing Berkshire’s ownership percentage without Buffett buying another share. The tax-deferred unrealised gain of approximately $27 billion continues compounding inside Berkshire’s structure—if sold, roughly $6–7 billion would be owed in taxes, permanently destroying that compounding capacity.
BNSF Railway: The Infrastructure Compounder
Entry (2009–2010): $44 billion total ($26.5 billion for remaining 77.4% plus assumed debt). Purchased at the GFC trough when freight volumes had collapsed. BNSF’s return on equity was 13% with return on assets of 4.4%. Buffett’s statement was definitive: “It’s an all-in wager on the economic future of the United States.”
The Compounding Mechanism: BNSF operates 32,500 miles of track across 28 states. Unlike See’s or Coca-Cola, this is a capital-intensive business requiring tens of billions in ongoing investment. Buffett accepted this because the moat is the most durable in American business: replacing these rail networks would cost hundreds of billions of dollars and take decades. Every year that passes, the rights-of-way become more valuable as highway congestion worsens and environmental regulations favour rail (which is 3–4x more fuel-efficient than trucking). By 2024, BNSF generated $5–6 billion in annual pre-tax earnings.
The Social Compact: Buffett described a “social compact” between railroads and the public: both sides must behave in ways that encourage good behaviour by the other. Berkshire reinvests massive sums into BNSF’s infrastructure; in return, regulators allow reasonable returns. This symbiotic relationship is the longest-duration competitive advantage in Berkshire’s portfolio—it is inconceivable that the United States will ever have fewer railroads than it does today.
What Differentiates the Infinite Compounder Model
The Trinity of Compounding: The float-funded infinite hold operates on three time horizons simultaneously. Short-term (1–3 years): insurance float provides cost-free capital when competitors must pay 5–10% for leverage. Medium-term (3–10 years): crisis purchasing provides entry prices 30–60% below intrinsic value, and the margin of safety gradually closes as businesses recover. Long-term (10–50+ years): infinite holding provides tax-free compounding of businesses whose competitive advantages strengthen with scale.
No hedge fund (quarterly redemptions), private equity fund (7–10 year fund life), or mutual fund (daily mark-to-market, annual distribution requirements) can simultaneously operate on all three horizons. Only permanent capital vehicles with float-funded leverage can buy during crises and hold forever. This structural advantage is the single most important factor explaining why Berkshire, Fairfax, and Markel have compounded at 19.9%, 18.9%, and approximately 15% respectively over decades—while the average hedge fund returns approximately 7% and the average mutual fund approximately 6% after fees.
The Gayner Articulation: Tom Gayner described this eloquently: “Being an investor makes me a better businessman, and being a businessman makes me a better investor.” He manages Markel’s $12.5 billion equity portfolio with 1% annual turnover—buying Berkshire in 1990 and still holding it 35 years later as the largest position. His first stock purchase when he joined Markel became his most productive. This is the infinite compounder model in its purest form: identify quality early, buy at reasonable prices, and let compound interest do the heavy lifting across decades.
Watsa’s Parallel: Fairfax India invested $469 million in Indian companies; the portfolio’s market value reached $753 million by 2023, with IIFL companies growing earnings at over 30% annually. Thomas Cook India was bought for ~$100 million and generated the Quess investment that returned 20x. These are the same compounding dynamics at work in a different geography—the float machine is not limited to American equities but extends wherever durable businesses can be found at reasonable prices by patient capital allocators.
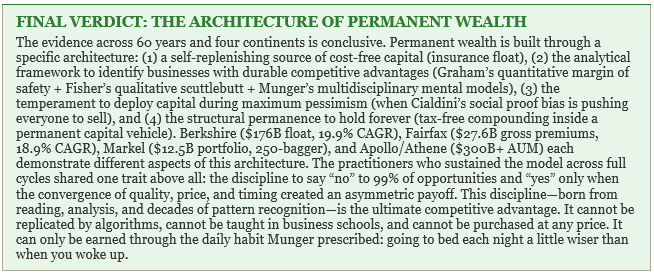
Charlie’s Verdict.
"Among the most formative influences on my investment philosophy has been Charlie Munger's latticework of mental models. It is through this multidisciplinary lens that the three components of the wealth creation machine documented in this report — float as permanent capital, crisis-driven capital allocation, and infinite compounding through patient holding — cease to be isolated concepts and begin to reveal themselves as a single, self-reinforcing system. The latticework does not merely help me understand each component in isolation; it allows me to synthesise how they interact, compound upon one another, and produce outcomes that no single framework could explain or predict."
Lollapalooza I: Why the Float Machine Compounds at 2–3x the Market
The Berkshire/Fairfax/Markel model works not because of any single advantage but because of at least five forces operating simultaneously:
Force 1 — Cost-Free Leverage (Economics): Insurance float provides 1.7:1 leverage at negative cost. A conventional fund borrowing at 5% needs its investments to earn 5% just to break even on the leverage. The float machine starts at zero cost—or below zero when underwriting is profitable. This is not a marginal advantage; it is a structural impossibility for any non-insurance competitor to replicate.
Force 2 — Permanence of Capital (Structural): Hedge funds face quarterly redemptions. PE funds have 7–10 year lives. Mutual funds must mark to market daily. The float machine’s capital is permanent: there is no redemption mechanism, no fund life, no forced selling. This eliminates what Munger called the single greatest source of investment error—being forced to sell at the wrong time.
Force 3 — Tax Deferral (Mathematics): Never selling means never paying capital gains taxes on unrealised appreciation. The $27 billion in unrealised Coca-Cola gains has been compounding inside Berkshire for 37 years instead of being reduced by $6–7 billion in taxes. Over decades, the compounding difference between tax-deferred and tax-realised returns is enormous—Bogle estimated 2–3% annually.
Force 4 — Reputation as Permanent Capital (Behavioural): Sellers come to Berkshire not for the highest price but for certainty that their business, employees, and legacy will be preserved. This reputation—built over decades—gives Berkshire access to acquisition opportunities that no PE firm, no matter how well-capitalised, can access. Mrs. Blumkin sold Nebraska Furniture Mart on a handshake. Forest River’s founder pitched Buffett a price and they shook hands a week later. This is Cialdini’s ‘liking’ and ‘commitment’ principles generating deal flow that is structurally unavailable to competitors.
Force 5 — Counter-Cyclical Capacity (Temperamental): When markets crash, most investors are forced to sell (margin calls, redemptions, career risk). The float machine is forced to do nothing—and chooses to buy. This asymmetry, repeated across decades of cycles, means the float machine systematically buys low and holds forever. It is the behavioural inverse of every psychological bias Munger catalogued: where others panic (social proof), the float machine acts rationally; where others anchor to recent losses (deprival super-reaction), the float machine anchors to intrinsic value.
Individually, each force might add 2–4% annually to returns. But the Lollapalooza effect means they do not merely add—they multiply. Cost-free leverage applied to tax-free compounding of counter-cyclically purchased permanent capital, accessed through a reputational moat that generates proprietary deal flow—this is not five advantages; it is one self-reinforcing system where each advantage strengthens the others.
Lollapalooza II: Why Crisis Buying Generates Outsized Returns
The crisis-buying returns documented in this report—Goldman Sachs ($6.7B from $5B), Watsa’s CDS ($4.2B from $344M), Japanese trading houses (3.8x in five years)—are not explained by stock-picking skill alone. They are explained by the simultaneous operation of at least four psychological/structural forces:
Deprival Super-Reaction × Social Proof: During a crisis, investors who have suffered losses react with disproportionate fear (deprival super-reaction). This fear is amplified by watching others sell (social proof). The combination drives prices far below intrinsic value—not because fundamental analysis suggests lower values, but because psychology has overwhelmed analysis. The crisis buyer profits from the gap between the psychologically-driven market price and the analytically-derived intrinsic value.
Margin of Safety × Structured Terms: Buffett’s 2008 deals combined Graham’s margin of safety (buying below intrinsic value) with Security Analysis’s preferred stock structure (guaranteed downside protection). The 10% preferred dividend was the floor; the warrants were the call option on recovery. This double protection meant Buffett could not lose meaningfully even in a worst-case scenario, while his upside was unlimited. This is not just buying cheap—it is structuring the purchase so that the range of outcomes is asymmetrically favourable.
Availability Bias (Inverted): During the GFC, the most ‘available’ mental image was Lehman Brothers collapsing. This vivid, recent image caused investors to overweight the probability that Goldman Sachs and GE would also collapse. Buffett’s advantage was that he had a different ‘available’ image—sixty years of watching American business recover from every crisis. His personal history was his antidote to availability bias.
Doubt-Avoidance (Inverted): Most investors, facing extreme uncertainty in 2008, rushed to resolve their doubt by selling (removing the uncomfortable ambiguity). Buffett, trained by decades of experience, was comfortable holding doubt—sitting with uncertainty rather than rushing to resolve it. This is what Munger meant when he said the ability to sit on your ass is the most important investment skill. Not acting is the hardest thing to do when your brain is screaming to resolve uncertainty.
Lollapalooza III: Why Infinite Compounders Accelerate Over Time
The most counterintuitive finding in the report is that See’s Candies, Coca-Cola, and GEICO generate more value per year now than they did in their early decades. This acceleration—which contradicts the financial textbook assumption of mean-reversion—is explained by a Lollapalooza of compounding forces:
Pricing Power × Consistency Bias (Cialdini): Once a consumer commits to a brand (buying See’s chocolates for Valentine’s Day, drinking Coca-Cola), the consistency principle kicks in: switching requires conscious effort, while continuing requires none. Each year of continued consumption deepens the habit. Each price increase, if modest, is accepted because the commitment to the brand has already been made. The result is that pricing power strengthens with time, not weakens—because the consumer’s psychological investment in the brand grows with each repetition.
Scale Economies × Contrast-Misreaction: GEICO’s cost advantage over agent-based insurers grows with each additional policyholder (more data, more efficient claims processing, greater advertising efficiency). But this growth is so gradual that competitors suffer from contrast-misreaction tendency—they never experience a sharp enough contrast to trigger alarm. By the time they notice, GEICO has risen from fifth to second in market share, and the cost advantage has become insurmountable.
Retained Earnings × Compound Interest: Every dollar See’s earns is sent to Omaha and redeployed at Buffett’s company-wide return rate. See’s generates $80 million annually on a $25 million original investment—but those $80 million, reinvested across Berkshire’s portfolio, generate further returns at 15–20% annually. The compounding is double-layered: the business compounds its own earnings through pricing power, AND the parent compounds the extracted earnings through reinvestment. This is what Munger called “the greatest force in the universe.”
“The first rule of compounding: never interrupt it unnecessarily.”— Charlie Munger
"This report is intended as an educational resource grounded in conceptual thinking and multidisciplinary analysis. While every effort has been made to source and verify the data presented, some figures — particularly historical balance sheet estimates, cumulative return calculations, and pre-1996 financial data — may contain approximations and should not be treated as audited or definitive. The value of this work lies not in the precision of any individual number but in the frameworks, patterns, and investment philosophy it illustrates. Readers are encouraged to verify specific figures independently before incorporating them into any investment decision. Nothing in this report constitutes financial advice."